Immigrants from Eastern Europe vs Immigrants from Serbia Associate's Degree
COMPARE
Immigrants from Eastern Europe
Immigrants from Serbia
Associate's Degree
Associate's Degree Comparison
Immigrants from Eastern Europe
Immigrants from Serbia
50.5%
ASSOCIATE'S DEGREE
99.1/ 100
METRIC RATING
78th/ 347
METRIC RANK
51.7%
ASSOCIATE'S DEGREE
99.8/ 100
METRIC RATING
59th/ 347
METRIC RANK
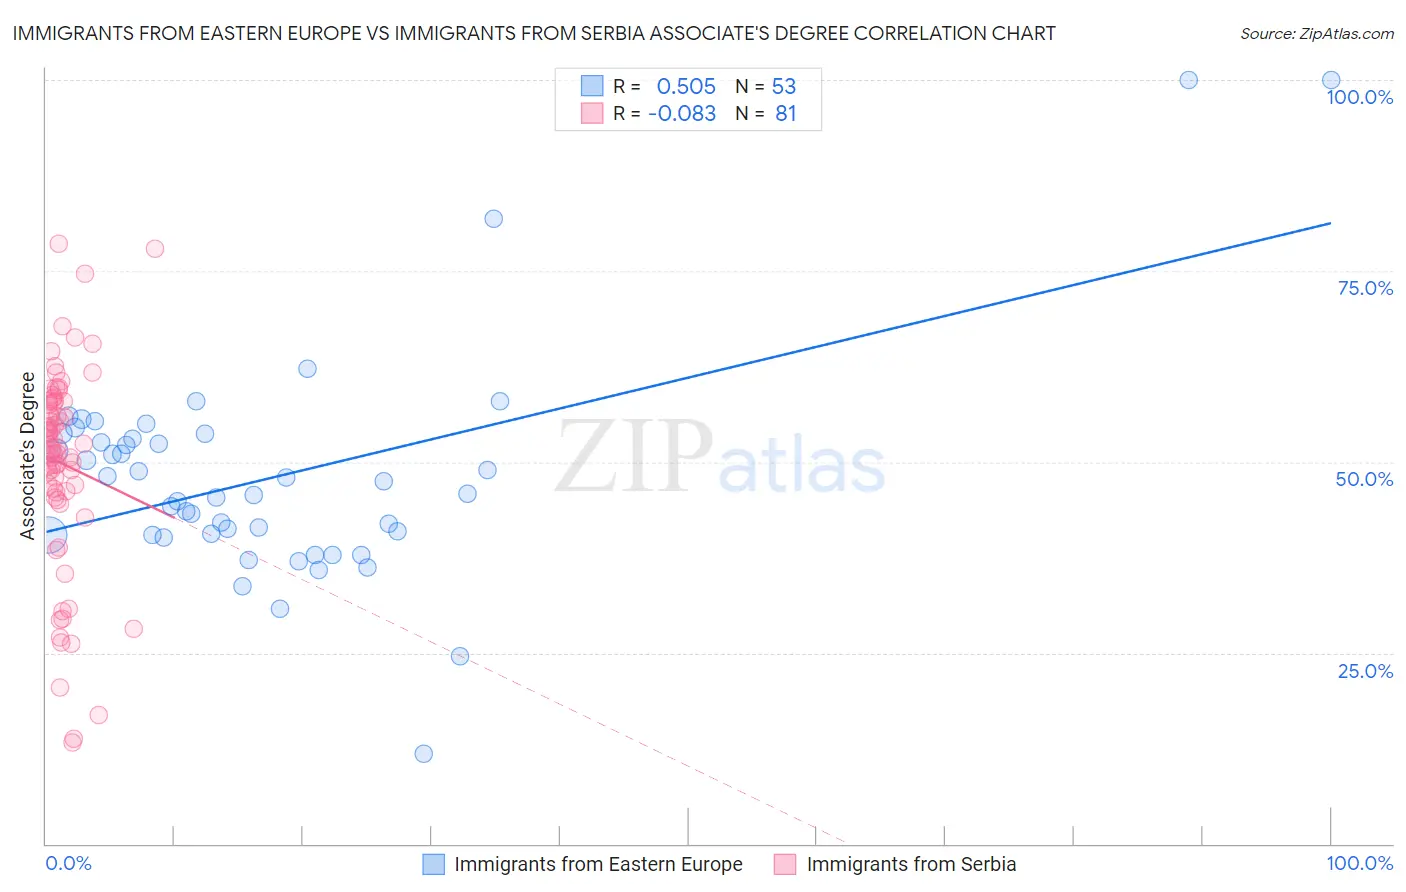
Immigrants from Eastern Europe vs Immigrants from Serbia Associate's Degree Correlation Chart
The statistical analysis conducted on geographies consisting of 475,831,649 people shows a substantial positive correlation between the proportion of Immigrants from Eastern Europe and percentage of population with at least associate's degree education in the United States with a correlation coefficient (R) of 0.505 and weighted average of 50.5%. Similarly, the statistical analysis conducted on geographies consisting of 131,744,029 people shows a slight negative correlation between the proportion of Immigrants from Serbia and percentage of population with at least associate's degree education in the United States with a correlation coefficient (R) of -0.083 and weighted average of 51.7%, a difference of 2.5%.
Associate's Degree Correlation Summary
| Measurement | Immigrants from Eastern Europe | Immigrants from Serbia |
| Minimum | 11.8% | 13.2% |
| Maximum | 100.0% | 78.6% |
| Range | 88.2% | 65.4% |
| Mean | 47.9% | 49.8% |
| Median | 45.8% | 51.9% |
| Interquartile 25% (IQ1) | 40.4% | 46.1% |
| Interquartile 75% (IQ3) | 53.3% | 57.9% |
| Interquartile Range (IQR) | 12.9% | 11.8% |
| Standard Deviation (Sample) | 14.6% | 13.3% |
| Standard Deviation (Population) | 14.5% | 13.2% |
Demographics Similar to Immigrants from Eastern Europe and Immigrants from Serbia by Associate's Degree
In terms of associate's degree, the demographic groups most similar to Immigrants from Eastern Europe are Immigrants from Lebanon (50.5%, a difference of 0.040%), Immigrants from Zimbabwe (50.5%, a difference of 0.080%), Immigrants from Scotland (50.6%, a difference of 0.29%), Lithuanian (50.6%, a difference of 0.33%), and Carpatho Rusyn (50.6%, a difference of 0.38%). Similarly, the demographic groups most similar to Immigrants from Serbia are New Zealander (51.8%, a difference of 0.13%), Immigrants from Bolivia (51.5%, a difference of 0.45%), Immigrants from Kazakhstan (51.4%, a difference of 0.60%), Bhutanese (51.4%, a difference of 0.61%), and South African (51.4%, a difference of 0.66%).
| Demographics | Rating | Rank | Associate's Degree |
| New Zealanders | 99.8 /100 | #58 | Exceptional 51.8% |
| Immigrants | Serbia | 99.8 /100 | #59 | Exceptional 51.7% |
| Immigrants | Bolivia | 99.7 /100 | #60 | Exceptional 51.5% |
| Immigrants | Kazakhstan | 99.7 /100 | #61 | Exceptional 51.4% |
| Bhutanese | 99.7 /100 | #62 | Exceptional 51.4% |
| South Africans | 99.7 /100 | #63 | Exceptional 51.4% |
| Immigrants | Netherlands | 99.7 /100 | #64 | Exceptional 51.4% |
| Zimbabweans | 99.7 /100 | #65 | Exceptional 51.3% |
| Immigrants | Europe | 99.7 /100 | #66 | Exceptional 51.3% |
| Argentineans | 99.6 /100 | #67 | Exceptional 51.2% |
| Immigrants | Indonesia | 99.5 /100 | #68 | Exceptional 51.0% |
| Egyptians | 99.5 /100 | #69 | Exceptional 50.9% |
| Immigrants | Argentina | 99.5 /100 | #70 | Exceptional 50.9% |
| Immigrants | Romania | 99.5 /100 | #71 | Exceptional 50.9% |
| Immigrants | Pakistan | 99.5 /100 | #72 | Exceptional 50.9% |
| Carpatho Rusyns | 99.3 /100 | #73 | Exceptional 50.6% |
| Lithuanians | 99.3 /100 | #74 | Exceptional 50.6% |
| Immigrants | Scotland | 99.3 /100 | #75 | Exceptional 50.6% |
| Immigrants | Zimbabwe | 99.2 /100 | #76 | Exceptional 50.5% |
| Immigrants | Lebanon | 99.1 /100 | #77 | Exceptional 50.5% |
| Immigrants | Eastern Europe | 99.1 /100 | #78 | Exceptional 50.5% |