French vs Hmong Associate's Degree
COMPARE
French
Hmong
Associate's Degree
Associate's Degree Comparison
French
Hmong
45.4%
ASSOCIATE'S DEGREE
25.6/ 100
METRIC RATING
196th/ 347
METRIC RANK
43.4%
ASSOCIATE'S DEGREE
3.2/ 100
METRIC RATING
228th/ 347
METRIC RANK
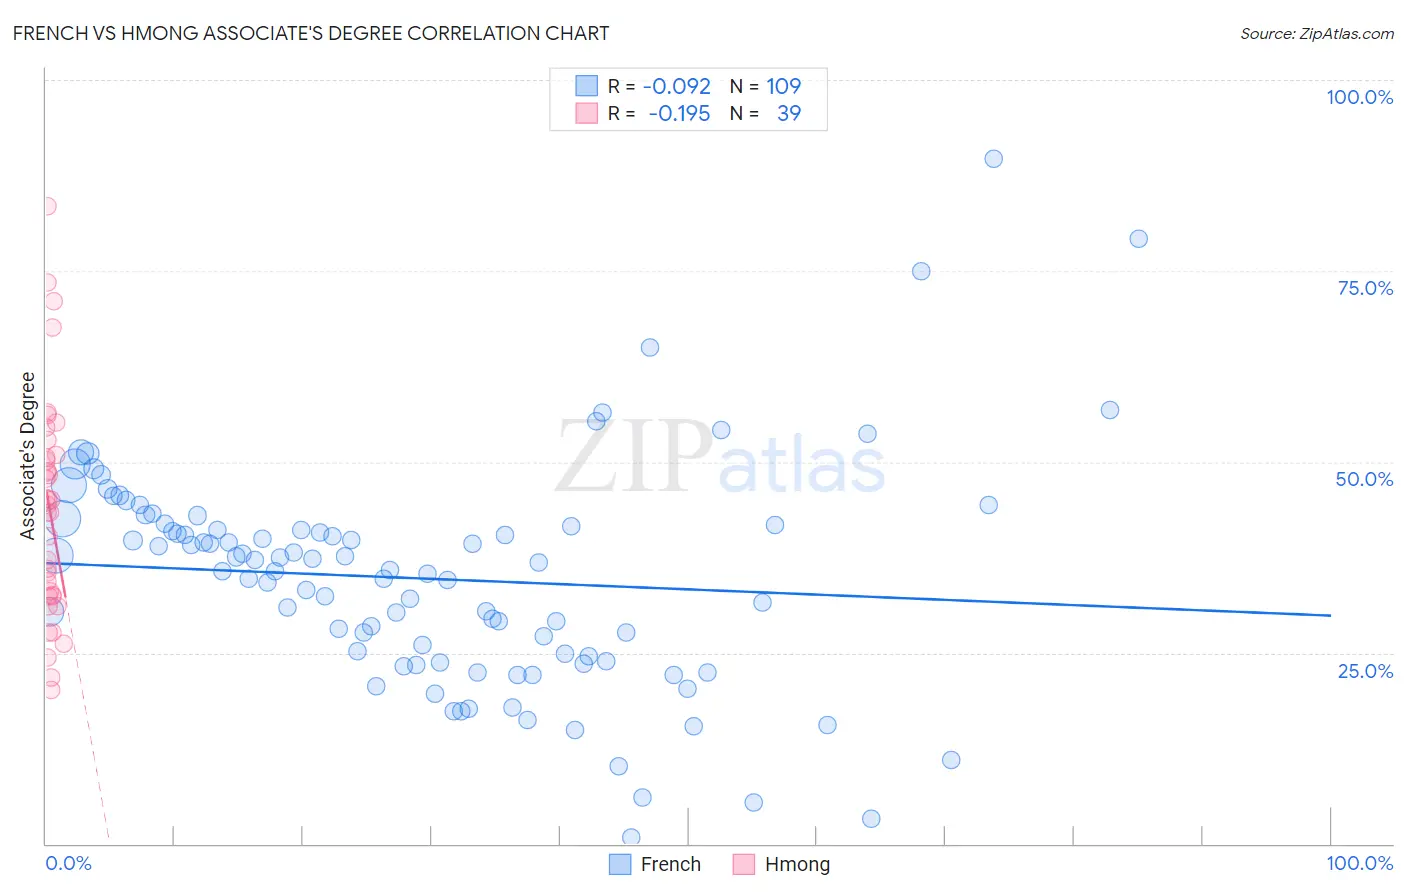
French vs Hmong Associate's Degree Correlation Chart
The statistical analysis conducted on geographies consisting of 572,343,340 people shows a slight negative correlation between the proportion of French and percentage of population with at least associate's degree education in the United States with a correlation coefficient (R) of -0.092 and weighted average of 45.4%. Similarly, the statistical analysis conducted on geographies consisting of 24,680,511 people shows a poor negative correlation between the proportion of Hmong and percentage of population with at least associate's degree education in the United States with a correlation coefficient (R) of -0.195 and weighted average of 43.4%, a difference of 4.7%.
Associate's Degree Correlation Summary
| Measurement | French | Hmong |
| Minimum | 0.78% | 20.2% |
| Maximum | 89.7% | 83.4% |
| Range | 88.9% | 63.2% |
| Mean | 34.7% | 43.7% |
| Median | 35.9% | 44.4% |
| Interquartile 25% (IQ1) | 24.2% | 32.4% |
| Interquartile 75% (IQ3) | 41.7% | 50.9% |
| Interquartile Range (IQR) | 17.5% | 18.6% |
| Standard Deviation (Sample) | 14.6% | 14.5% |
| Standard Deviation (Population) | 14.6% | 14.3% |
Similar Demographics by Associate's Degree
Demographics Similar to French by Associate's Degree
In terms of associate's degree, the demographic groups most similar to French are German (45.5%, a difference of 0.090%), Immigrants from Peru (45.5%, a difference of 0.19%), Scotch-Irish (45.3%, a difference of 0.35%), Immigrants from Bangladesh (45.2%, a difference of 0.45%), and Immigrants from Senegal (45.2%, a difference of 0.47%).
| Demographics | Rating | Rank | Associate's Degree |
| Immigrants | Oceania | 34.7 /100 | #189 | Fair 45.8% |
| Vietnamese | 34.0 /100 | #190 | Fair 45.8% |
| Koreans | 33.8 /100 | #191 | Fair 45.8% |
| Celtics | 33.3 /100 | #192 | Fair 45.8% |
| Immigrants | Cameroon | 31.0 /100 | #193 | Fair 45.7% |
| Immigrants | Peru | 27.6 /100 | #194 | Fair 45.5% |
| Germans | 26.5 /100 | #195 | Fair 45.5% |
| French | 25.6 /100 | #196 | Fair 45.4% |
| Scotch-Irish | 22.3 /100 | #197 | Fair 45.3% |
| Immigrants | Bangladesh | 21.3 /100 | #198 | Fair 45.2% |
| Immigrants | Senegal | 21.2 /100 | #199 | Fair 45.2% |
| Senegalese | 21.1 /100 | #200 | Fair 45.2% |
| Immigrants | Vietnam | 20.8 /100 | #201 | Fair 45.2% |
| Spaniards | 20.4 /100 | #202 | Fair 45.2% |
| Immigrants | South Eastern Asia | 20.2 /100 | #203 | Fair 45.2% |
Demographics Similar to Hmong by Associate's Degree
In terms of associate's degree, the demographic groups most similar to Hmong are Immigrants from Trinidad and Tobago (43.3%, a difference of 0.16%), Immigrants from Barbados (43.3%, a difference of 0.23%), Liberian (43.3%, a difference of 0.23%), Trinidadian and Tobagonian (43.6%, a difference of 0.44%), and Immigrants from Burma/Myanmar (43.7%, a difference of 0.62%).
| Demographics | Rating | Rank | Associate's Degree |
| Immigrants | Western Africa | 6.6 /100 | #221 | Tragic 44.1% |
| Barbadians | 5.8 /100 | #222 | Tragic 43.9% |
| Sub-Saharan Africans | 5.5 /100 | #223 | Tragic 43.9% |
| West Indians | 5.2 /100 | #224 | Tragic 43.8% |
| Guamanians/Chamorros | 4.8 /100 | #225 | Tragic 43.8% |
| Immigrants | Burma/Myanmar | 4.3 /100 | #226 | Tragic 43.7% |
| Trinidadians and Tobagonians | 4.0 /100 | #227 | Tragic 43.6% |
| Hmong | 3.2 /100 | #228 | Tragic 43.4% |
| Immigrants | Trinidad and Tobago | 3.0 /100 | #229 | Tragic 43.3% |
| Immigrants | Barbados | 2.9 /100 | #230 | Tragic 43.3% |
| Liberians | 2.9 /100 | #231 | Tragic 43.3% |
| Native Hawaiians | 2.3 /100 | #232 | Tragic 43.1% |
| Tongans | 2.2 /100 | #233 | Tragic 43.0% |
| Tlingit-Haida | 2.1 /100 | #234 | Tragic 43.0% |
| Ecuadorians | 2.0 /100 | #235 | Tragic 43.0% |