French vs South American Indian Associate's Degree
COMPARE
French
South American Indian
Associate's Degree
Associate's Degree Comparison
French
South American Indians
45.4%
ASSOCIATE'S DEGREE
25.6/ 100
METRIC RATING
196th/ 347
METRIC RANK
47.4%
ASSOCIATE'S DEGREE
76.7/ 100
METRIC RATING
148th/ 347
METRIC RANK
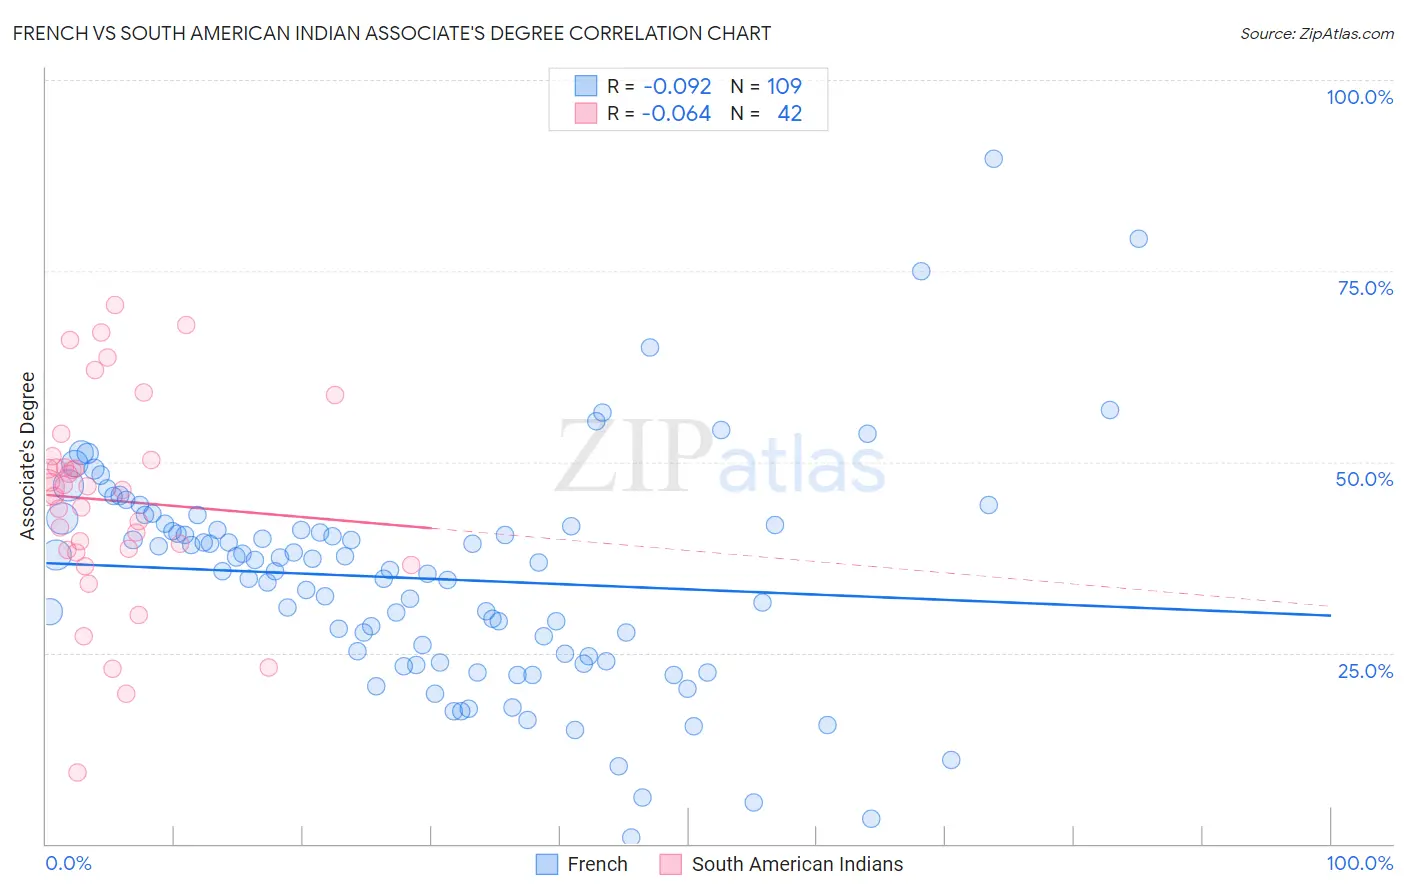
French vs South American Indian Associate's Degree Correlation Chart
The statistical analysis conducted on geographies consisting of 572,343,340 people shows a slight negative correlation between the proportion of French and percentage of population with at least associate's degree education in the United States with a correlation coefficient (R) of -0.092 and weighted average of 45.4%. Similarly, the statistical analysis conducted on geographies consisting of 164,573,088 people shows a slight negative correlation between the proportion of South American Indians and percentage of population with at least associate's degree education in the United States with a correlation coefficient (R) of -0.064 and weighted average of 47.4%, a difference of 4.3%.
Associate's Degree Correlation Summary
| Measurement | French | South American Indian |
| Minimum | 0.78% | 9.4% |
| Maximum | 89.7% | 70.6% |
| Range | 88.9% | 61.2% |
| Mean | 34.7% | 45.0% |
| Median | 35.9% | 46.5% |
| Interquartile 25% (IQ1) | 24.2% | 38.4% |
| Interquartile 75% (IQ3) | 41.7% | 50.2% |
| Interquartile Range (IQR) | 17.5% | 11.8% |
| Standard Deviation (Sample) | 14.6% | 13.3% |
| Standard Deviation (Population) | 14.6% | 13.2% |
Similar Demographics by Associate's Degree
Demographics Similar to French by Associate's Degree
In terms of associate's degree, the demographic groups most similar to French are German (45.5%, a difference of 0.090%), Immigrants from Peru (45.5%, a difference of 0.19%), Scotch-Irish (45.3%, a difference of 0.35%), Immigrants from Bangladesh (45.2%, a difference of 0.45%), and Immigrants from Senegal (45.2%, a difference of 0.47%).
| Demographics | Rating | Rank | Associate's Degree |
| Immigrants | Oceania | 34.7 /100 | #189 | Fair 45.8% |
| Vietnamese | 34.0 /100 | #190 | Fair 45.8% |
| Koreans | 33.8 /100 | #191 | Fair 45.8% |
| Celtics | 33.3 /100 | #192 | Fair 45.8% |
| Immigrants | Cameroon | 31.0 /100 | #193 | Fair 45.7% |
| Immigrants | Peru | 27.6 /100 | #194 | Fair 45.5% |
| Germans | 26.5 /100 | #195 | Fair 45.5% |
| French | 25.6 /100 | #196 | Fair 45.4% |
| Scotch-Irish | 22.3 /100 | #197 | Fair 45.3% |
| Immigrants | Bangladesh | 21.3 /100 | #198 | Fair 45.2% |
| Immigrants | Senegal | 21.2 /100 | #199 | Fair 45.2% |
| Senegalese | 21.1 /100 | #200 | Fair 45.2% |
| Immigrants | Vietnam | 20.8 /100 | #201 | Fair 45.2% |
| Spaniards | 20.4 /100 | #202 | Fair 45.2% |
| Immigrants | South Eastern Asia | 20.2 /100 | #203 | Fair 45.2% |
Demographics Similar to South American Indians by Associate's Degree
In terms of associate's degree, the demographic groups most similar to South American Indians are Immigrants from Armenia (47.4%, a difference of 0.010%), Iraqi (47.4%, a difference of 0.050%), Danish (47.4%, a difference of 0.060%), Immigrants from North Macedonia (47.4%, a difference of 0.070%), and Immigrants from Sudan (47.4%, a difference of 0.12%).
| Demographics | Rating | Rank | Associate's Degree |
| Taiwanese | 83.3 /100 | #141 | Excellent 47.7% |
| Sierra Leoneans | 82.9 /100 | #142 | Excellent 47.7% |
| Norwegians | 81.0 /100 | #143 | Excellent 47.6% |
| Slavs | 80.5 /100 | #144 | Excellent 47.6% |
| Canadians | 79.0 /100 | #145 | Good 47.5% |
| Immigrants | Sudan | 77.9 /100 | #146 | Good 47.4% |
| Danes | 77.3 /100 | #147 | Good 47.4% |
| South American Indians | 76.7 /100 | #148 | Good 47.4% |
| Immigrants | Armenia | 76.6 /100 | #149 | Good 47.4% |
| Iraqis | 76.2 /100 | #150 | Good 47.4% |
| Immigrants | North Macedonia | 76.0 /100 | #151 | Good 47.4% |
| Immigrants | Afghanistan | 74.3 /100 | #152 | Good 47.3% |
| Czechs | 72.2 /100 | #153 | Good 47.2% |
| Immigrants | Kenya | 72.1 /100 | #154 | Good 47.2% |
| Kenyans | 70.6 /100 | #155 | Good 47.1% |