Okinawan vs Immigrants from Serbia Associate's Degree
COMPARE
Okinawan
Immigrants from Serbia
Associate's Degree
Associate's Degree Comparison
Okinawans
Immigrants from Serbia
57.7%
ASSOCIATE'S DEGREE
100.0/ 100
METRIC RATING
6th/ 347
METRIC RANK
51.7%
ASSOCIATE'S DEGREE
99.8/ 100
METRIC RATING
59th/ 347
METRIC RANK
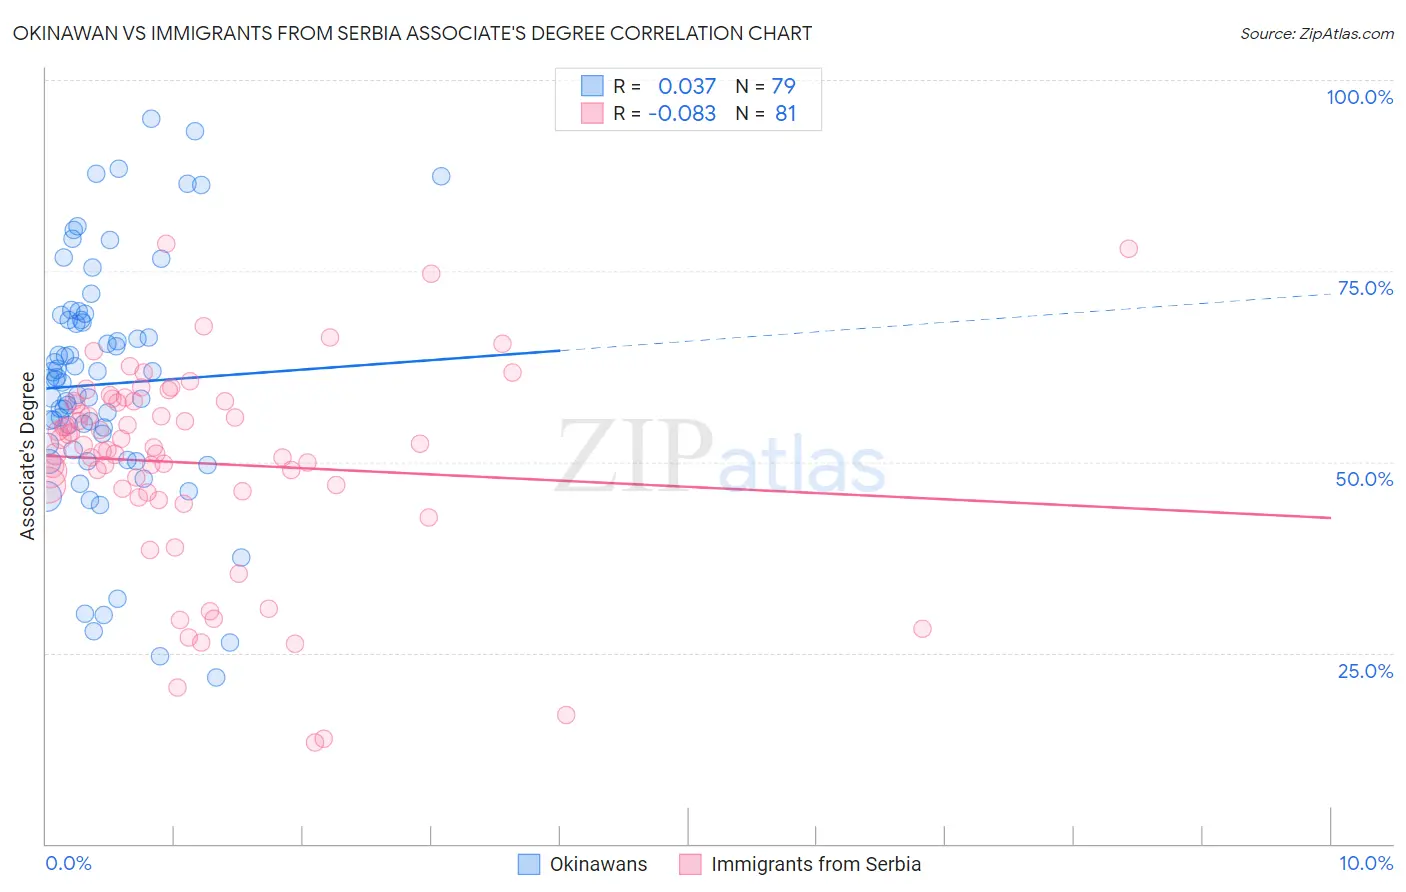
Okinawan vs Immigrants from Serbia Associate's Degree Correlation Chart
The statistical analysis conducted on geographies consisting of 73,779,368 people shows no correlation between the proportion of Okinawans and percentage of population with at least associate's degree education in the United States with a correlation coefficient (R) of 0.037 and weighted average of 57.7%. Similarly, the statistical analysis conducted on geographies consisting of 131,744,029 people shows a slight negative correlation between the proportion of Immigrants from Serbia and percentage of population with at least associate's degree education in the United States with a correlation coefficient (R) of -0.083 and weighted average of 51.7%, a difference of 11.5%.
Associate's Degree Correlation Summary
| Measurement | Okinawan | Immigrants from Serbia |
| Minimum | 21.7% | 13.2% |
| Maximum | 95.0% | 78.6% |
| Range | 73.3% | 65.4% |
| Mean | 60.2% | 49.8% |
| Median | 60.7% | 51.9% |
| Interquartile 25% (IQ1) | 51.5% | 46.1% |
| Interquartile 75% (IQ3) | 68.7% | 57.9% |
| Interquartile Range (IQR) | 17.1% | 11.8% |
| Standard Deviation (Sample) | 15.8% | 13.3% |
| Standard Deviation (Population) | 15.7% | 13.2% |
Similar Demographics by Associate's Degree
Demographics Similar to Okinawans by Associate's Degree
In terms of associate's degree, the demographic groups most similar to Okinawans are Immigrants from Iran (57.7%, a difference of 0.060%), Thai (57.4%, a difference of 0.46%), Iranian (58.2%, a difference of 0.83%), Immigrants from Taiwan (58.4%, a difference of 1.2%), and Immigrants from India (58.5%, a difference of 1.5%).
| Demographics | Rating | Rank | Associate's Degree |
| Filipinos | 100.0 /100 | #1 | Exceptional 59.8% |
| Immigrants | Singapore | 100.0 /100 | #2 | Exceptional 58.9% |
| Immigrants | India | 100.0 /100 | #3 | Exceptional 58.5% |
| Immigrants | Taiwan | 100.0 /100 | #4 | Exceptional 58.4% |
| Iranians | 100.0 /100 | #5 | Exceptional 58.2% |
| Okinawans | 100.0 /100 | #6 | Exceptional 57.7% |
| Immigrants | Iran | 100.0 /100 | #7 | Exceptional 57.7% |
| Thais | 100.0 /100 | #8 | Exceptional 57.4% |
| Immigrants | Israel | 100.0 /100 | #9 | Exceptional 56.8% |
| Cypriots | 100.0 /100 | #10 | Exceptional 56.4% |
| Immigrants | Australia | 100.0 /100 | #11 | Exceptional 55.8% |
| Immigrants | South Central Asia | 100.0 /100 | #12 | Exceptional 55.7% |
| Immigrants | China | 100.0 /100 | #13 | Exceptional 55.5% |
| Immigrants | Hong Kong | 100.0 /100 | #14 | Exceptional 55.4% |
| Immigrants | Eastern Asia | 100.0 /100 | #15 | Exceptional 55.4% |
Demographics Similar to Immigrants from Serbia by Associate's Degree
In terms of associate's degree, the demographic groups most similar to Immigrants from Serbia are New Zealander (51.8%, a difference of 0.13%), Paraguayan (51.8%, a difference of 0.16%), Immigrants from Czechoslovakia (51.9%, a difference of 0.28%), Australian (51.9%, a difference of 0.30%), and Immigrants from Spain (51.9%, a difference of 0.33%).
| Demographics | Rating | Rank | Associate's Degree |
| Bolivians | 99.8 /100 | #52 | Exceptional 52.0% |
| Immigrants | Asia | 99.8 /100 | #53 | Exceptional 52.0% |
| Immigrants | Spain | 99.8 /100 | #54 | Exceptional 51.9% |
| Australians | 99.8 /100 | #55 | Exceptional 51.9% |
| Immigrants | Czechoslovakia | 99.8 /100 | #56 | Exceptional 51.9% |
| Paraguayans | 99.8 /100 | #57 | Exceptional 51.8% |
| New Zealanders | 99.8 /100 | #58 | Exceptional 51.8% |
| Immigrants | Serbia | 99.8 /100 | #59 | Exceptional 51.7% |
| Immigrants | Bolivia | 99.7 /100 | #60 | Exceptional 51.5% |
| Immigrants | Kazakhstan | 99.7 /100 | #61 | Exceptional 51.4% |
| Bhutanese | 99.7 /100 | #62 | Exceptional 51.4% |
| South Africans | 99.7 /100 | #63 | Exceptional 51.4% |
| Immigrants | Netherlands | 99.7 /100 | #64 | Exceptional 51.4% |
| Zimbabweans | 99.7 /100 | #65 | Exceptional 51.3% |
| Immigrants | Europe | 99.7 /100 | #66 | Exceptional 51.3% |