Tsimshian vs Hmong Associate's Degree
COMPARE
Tsimshian
Hmong
Associate's Degree
Associate's Degree Comparison
Tsimshian
Hmong
38.6%
ASSOCIATE'S DEGREE
0.0/ 100
METRIC RATING
301st/ 347
METRIC RANK
43.4%
ASSOCIATE'S DEGREE
3.2/ 100
METRIC RATING
228th/ 347
METRIC RANK
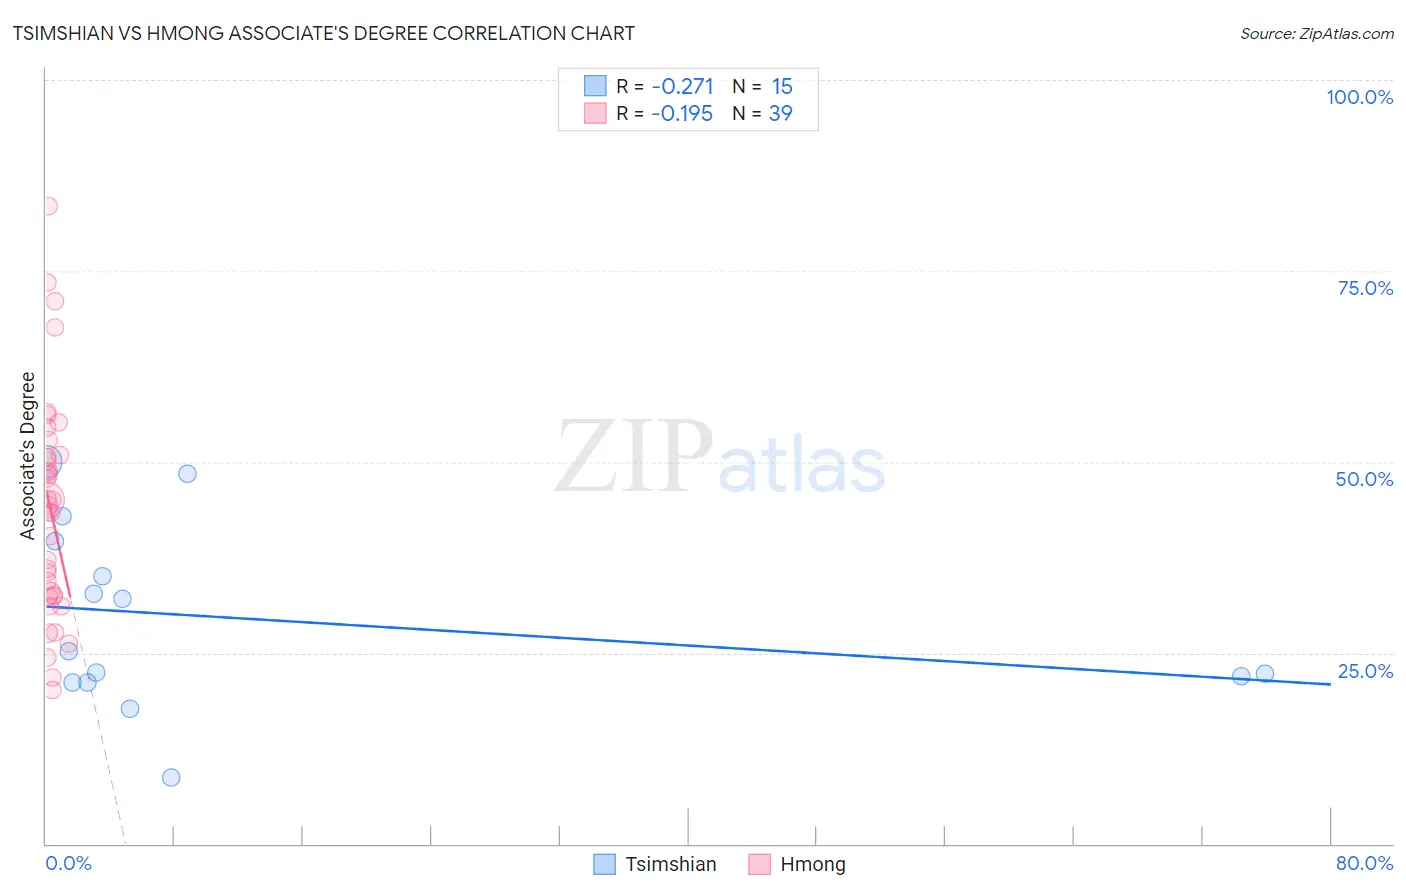
Tsimshian vs Hmong Associate's Degree Correlation Chart
The statistical analysis conducted on geographies consisting of 15,626,544 people shows a weak negative correlation between the proportion of Tsimshian and percentage of population with at least associate's degree education in the United States with a correlation coefficient (R) of -0.271 and weighted average of 38.6%. Similarly, the statistical analysis conducted on geographies consisting of 24,680,511 people shows a poor negative correlation between the proportion of Hmong and percentage of population with at least associate's degree education in the United States with a correlation coefficient (R) of -0.195 and weighted average of 43.4%, a difference of 12.5%.
Associate's Degree Correlation Summary
| Measurement | Tsimshian | Hmong |
| Minimum | 8.6% | 20.2% |
| Maximum | 50.0% | 83.4% |
| Range | 41.4% | 63.2% |
| Mean | 29.4% | 43.7% |
| Median | 25.2% | 44.4% |
| Interquartile 25% (IQ1) | 21.2% | 32.4% |
| Interquartile 75% (IQ3) | 39.6% | 50.9% |
| Interquartile Range (IQR) | 18.4% | 18.6% |
| Standard Deviation (Sample) | 12.0% | 14.5% |
| Standard Deviation (Population) | 11.5% | 14.3% |
Similar Demographics by Associate's Degree
Demographics Similar to Tsimshian by Associate's Degree
In terms of associate's degree, the demographic groups most similar to Tsimshian are Chickasaw (38.6%, a difference of 0.060%), Ute (38.6%, a difference of 0.090%), Colville (38.5%, a difference of 0.15%), Cheyenne (38.7%, a difference of 0.19%), and Guatemalan (38.5%, a difference of 0.24%).
| Demographics | Rating | Rank | Associate's Degree |
| Salvadorans | 0.0 /100 | #294 | Tragic 39.0% |
| Hondurans | 0.0 /100 | #295 | Tragic 38.9% |
| Cherokee | 0.0 /100 | #296 | Tragic 38.9% |
| Cape Verdeans | 0.0 /100 | #297 | Tragic 38.8% |
| Cheyenne | 0.0 /100 | #298 | Tragic 38.7% |
| Ute | 0.0 /100 | #299 | Tragic 38.6% |
| Chickasaw | 0.0 /100 | #300 | Tragic 38.6% |
| Tsimshian | 0.0 /100 | #301 | Tragic 38.6% |
| Colville | 0.0 /100 | #302 | Tragic 38.5% |
| Guatemalans | 0.0 /100 | #303 | Tragic 38.5% |
| Sioux | 0.0 /100 | #304 | Tragic 38.5% |
| Immigrants | Honduras | 0.0 /100 | #305 | Tragic 38.5% |
| Shoshone | 0.0 /100 | #306 | Tragic 38.4% |
| Immigrants | El Salvador | 0.0 /100 | #307 | Tragic 38.4% |
| Mexican American Indians | 0.0 /100 | #308 | Tragic 38.2% |
Demographics Similar to Hmong by Associate's Degree
In terms of associate's degree, the demographic groups most similar to Hmong are Immigrants from Trinidad and Tobago (43.3%, a difference of 0.16%), Immigrants from Barbados (43.3%, a difference of 0.23%), Liberian (43.3%, a difference of 0.23%), Trinidadian and Tobagonian (43.6%, a difference of 0.44%), and Immigrants from Burma/Myanmar (43.7%, a difference of 0.62%).
| Demographics | Rating | Rank | Associate's Degree |
| Immigrants | Western Africa | 6.6 /100 | #221 | Tragic 44.1% |
| Barbadians | 5.8 /100 | #222 | Tragic 43.9% |
| Sub-Saharan Africans | 5.5 /100 | #223 | Tragic 43.9% |
| West Indians | 5.2 /100 | #224 | Tragic 43.8% |
| Guamanians/Chamorros | 4.8 /100 | #225 | Tragic 43.8% |
| Immigrants | Burma/Myanmar | 4.3 /100 | #226 | Tragic 43.7% |
| Trinidadians and Tobagonians | 4.0 /100 | #227 | Tragic 43.6% |
| Hmong | 3.2 /100 | #228 | Tragic 43.4% |
| Immigrants | Trinidad and Tobago | 3.0 /100 | #229 | Tragic 43.3% |
| Immigrants | Barbados | 2.9 /100 | #230 | Tragic 43.3% |
| Liberians | 2.9 /100 | #231 | Tragic 43.3% |
| Native Hawaiians | 2.3 /100 | #232 | Tragic 43.1% |
| Tongans | 2.2 /100 | #233 | Tragic 43.0% |
| Tlingit-Haida | 2.1 /100 | #234 | Tragic 43.0% |
| Ecuadorians | 2.0 /100 | #235 | Tragic 43.0% |