French Canadian vs Spanish American Indian Master's Degree
COMPARE
French Canadian
Spanish American Indian
Master's Degree
Master's Degree Comparison
French Canadians
Spanish American Indians
14.1%
MASTER'S DEGREE
14.9/ 100
METRIC RATING
218th/ 347
METRIC RANK
9.6%
MASTER'S DEGREE
0.0/ 100
METRIC RATING
339th/ 347
METRIC RANK
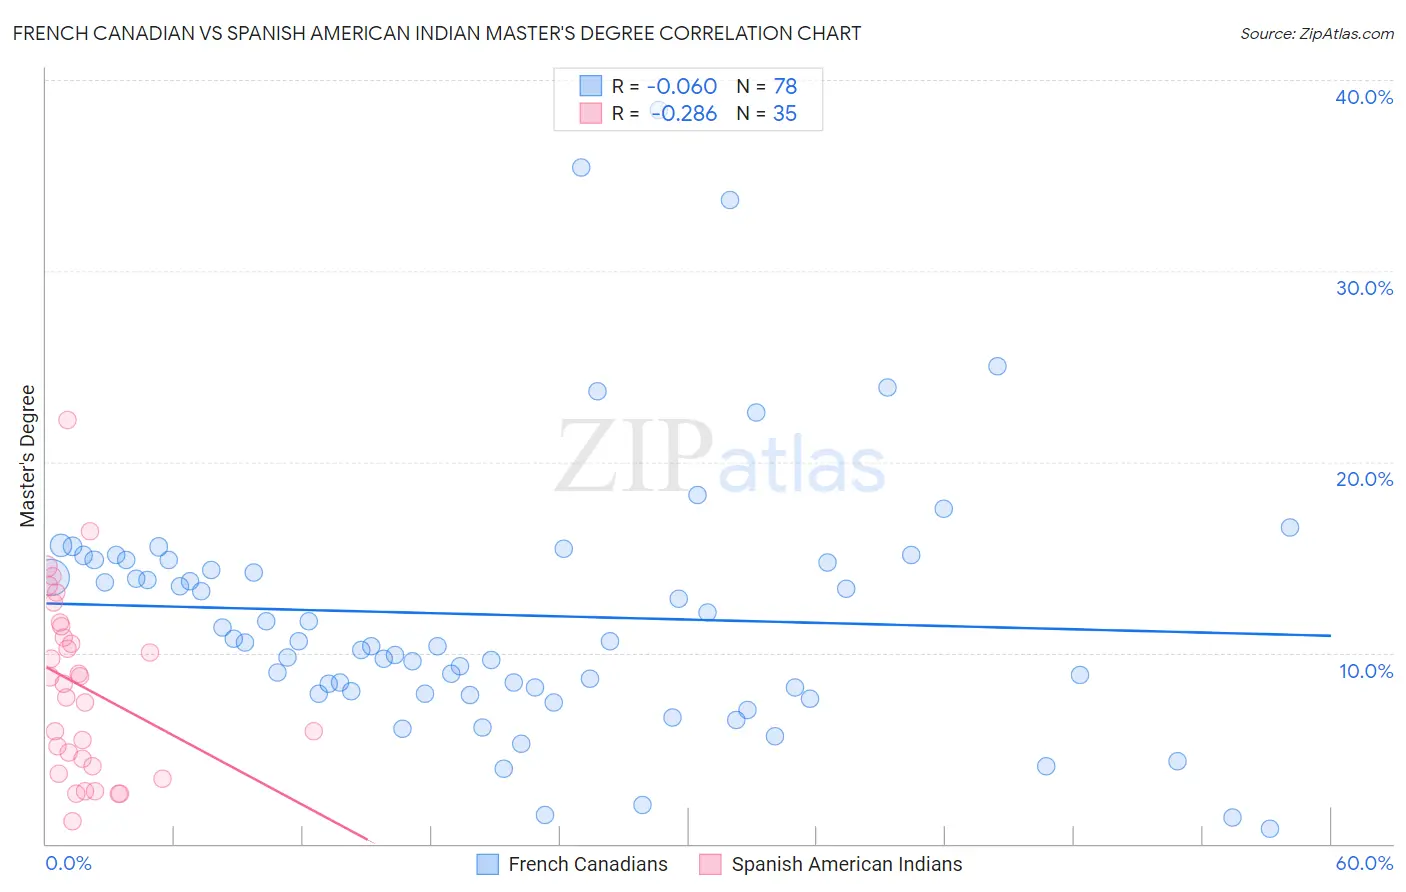
French Canadian vs Spanish American Indian Master's Degree Correlation Chart
The statistical analysis conducted on geographies consisting of 502,359,495 people shows a slight negative correlation between the proportion of French Canadians and percentage of population with at least master's degree education in the United States with a correlation coefficient (R) of -0.060 and weighted average of 14.1%. Similarly, the statistical analysis conducted on geographies consisting of 73,142,188 people shows a weak negative correlation between the proportion of Spanish American Indians and percentage of population with at least master's degree education in the United States with a correlation coefficient (R) of -0.286 and weighted average of 9.6%, a difference of 47.1%.
Master's Degree Correlation Summary
| Measurement | French Canadian | Spanish American Indian |
| Minimum | 0.81% | 1.2% |
| Maximum | 38.5% | 22.2% |
| Range | 37.6% | 21.0% |
| Mean | 12.0% | 8.2% |
| Median | 10.6% | 8.4% |
| Interquartile 25% (IQ1) | 8.0% | 4.1% |
| Interquartile 75% (IQ3) | 14.9% | 11.4% |
| Interquartile Range (IQR) | 6.9% | 7.3% |
| Standard Deviation (Sample) | 6.9% | 4.8% |
| Standard Deviation (Population) | 6.9% | 4.7% |
Similar Demographics by Master's Degree
Demographics Similar to French Canadians by Master's Degree
In terms of master's degree, the demographic groups most similar to French Canadians are Immigrants from Somalia (14.1%, a difference of 0.25%), Immigrants from Trinidad and Tobago (14.1%, a difference of 0.25%), Immigrants from Vietnam (14.1%, a difference of 0.32%), Norwegian (14.0%, a difference of 0.35%), and German (14.0%, a difference of 0.50%).
| Demographics | Rating | Rank | Master's Degree |
| Somalis | 18.0 /100 | #211 | Poor 14.2% |
| Spanish | 17.8 /100 | #212 | Poor 14.2% |
| Immigrants | Thailand | 17.0 /100 | #213 | Poor 14.2% |
| Finns | 16.9 /100 | #214 | Poor 14.2% |
| Immigrants | Vietnam | 16.1 /100 | #215 | Poor 14.1% |
| Immigrants | Somalia | 15.8 /100 | #216 | Poor 14.1% |
| Immigrants | Trinidad and Tobago | 15.8 /100 | #217 | Poor 14.1% |
| French Canadians | 14.9 /100 | #218 | Poor 14.1% |
| Norwegians | 13.6 /100 | #219 | Poor 14.0% |
| Germans | 13.1 /100 | #220 | Poor 14.0% |
| Koreans | 12.7 /100 | #221 | Poor 14.0% |
| Ecuadorians | 12.6 /100 | #222 | Poor 14.0% |
| Immigrants | South Eastern Asia | 11.9 /100 | #223 | Poor 14.0% |
| Immigrants | Grenada | 11.8 /100 | #224 | Poor 14.0% |
| Portuguese | 11.2 /100 | #225 | Poor 13.9% |
Demographics Similar to Spanish American Indians by Master's Degree
In terms of master's degree, the demographic groups most similar to Spanish American Indians are Yakama (9.5%, a difference of 1.2%), Tohono O'odham (9.7%, a difference of 1.3%), Mexican (9.7%, a difference of 1.4%), Navajo (9.4%, a difference of 1.6%), and Immigrants from Mexico (9.3%, a difference of 2.9%).
| Demographics | Rating | Rank | Master's Degree |
| Immigrants | Azores | 0.0 /100 | #332 | Tragic 10.2% |
| Menominee | 0.0 /100 | #333 | Tragic 10.2% |
| Arapaho | 0.0 /100 | #334 | Tragic 10.0% |
| Immigrants | Central America | 0.0 /100 | #335 | Tragic 10.0% |
| Natives/Alaskans | 0.0 /100 | #336 | Tragic 9.9% |
| Mexicans | 0.0 /100 | #337 | Tragic 9.7% |
| Tohono O'odham | 0.0 /100 | #338 | Tragic 9.7% |
| Spanish American Indians | 0.0 /100 | #339 | Tragic 9.6% |
| Yakama | 0.0 /100 | #340 | Tragic 9.5% |
| Navajo | 0.0 /100 | #341 | Tragic 9.4% |
| Immigrants | Mexico | 0.0 /100 | #342 | Tragic 9.3% |
| Lumbee | 0.0 /100 | #343 | Tragic 9.3% |
| Pima | 0.0 /100 | #344 | Tragic 9.2% |
| Yuman | 0.0 /100 | #345 | Tragic 9.2% |
| Yup'ik | 0.0 /100 | #346 | Tragic 8.5% |