French Canadian vs Salvadoran Master's Degree
COMPARE
French Canadian
Salvadoran
Master's Degree
Master's Degree Comparison
French Canadians
Salvadorans
14.1%
MASTER'S DEGREE
14.9/ 100
METRIC RATING
218th/ 347
METRIC RANK
12.2%
MASTER'S DEGREE
0.3/ 100
METRIC RATING
270th/ 347
METRIC RANK
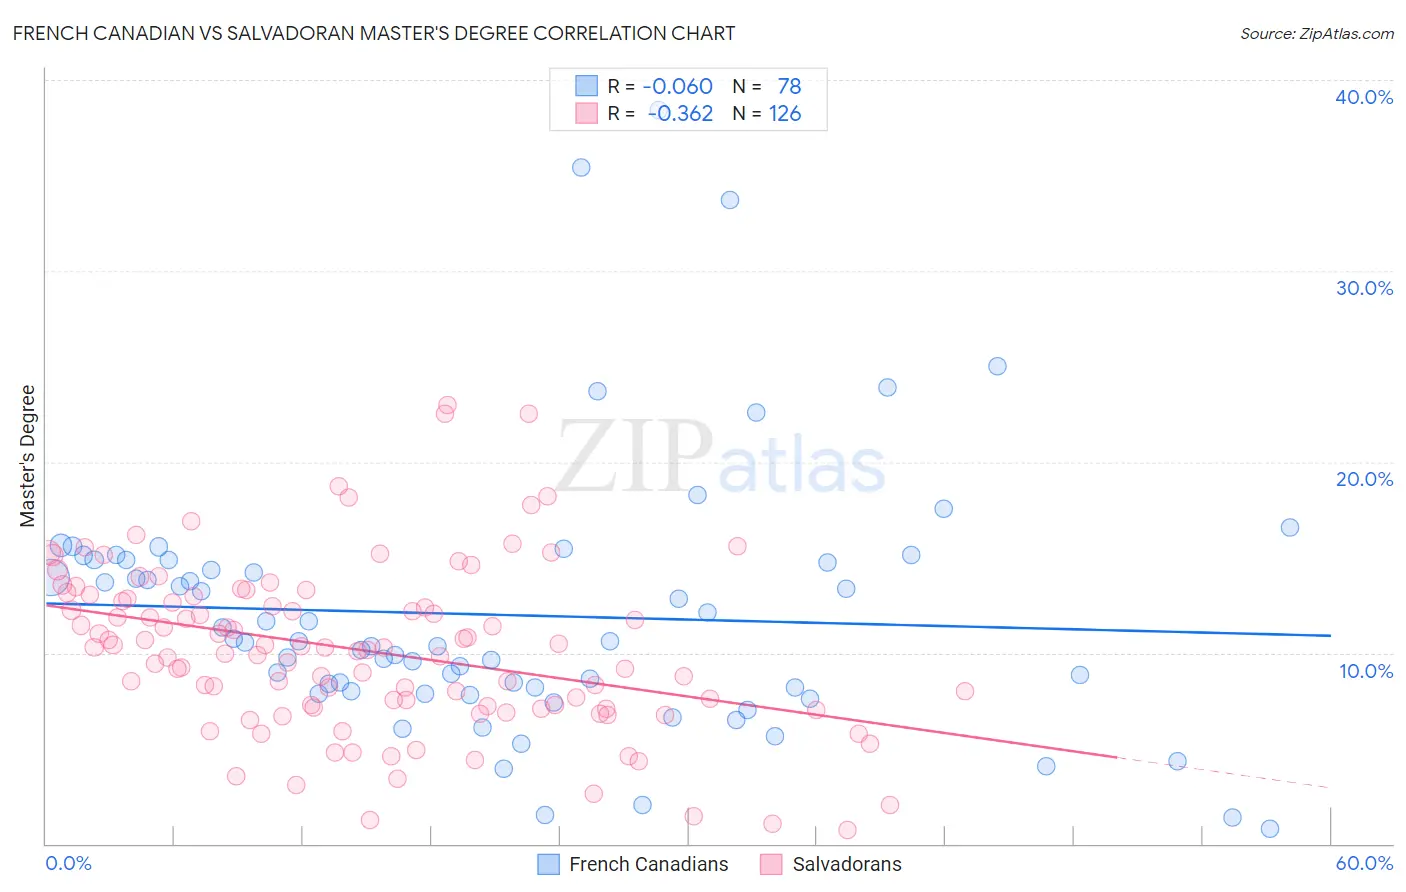
French Canadian vs Salvadoran Master's Degree Correlation Chart
The statistical analysis conducted on geographies consisting of 502,359,495 people shows a slight negative correlation between the proportion of French Canadians and percentage of population with at least master's degree education in the United States with a correlation coefficient (R) of -0.060 and weighted average of 14.1%. Similarly, the statistical analysis conducted on geographies consisting of 398,764,232 people shows a mild negative correlation between the proportion of Salvadorans and percentage of population with at least master's degree education in the United States with a correlation coefficient (R) of -0.362 and weighted average of 12.2%, a difference of 15.7%.
Master's Degree Correlation Summary
| Measurement | French Canadian | Salvadoran |
| Minimum | 0.81% | 0.69% |
| Maximum | 38.5% | 23.0% |
| Range | 37.6% | 22.3% |
| Mean | 12.0% | 10.1% |
| Median | 10.6% | 10.2% |
| Interquartile 25% (IQ1) | 8.0% | 7.1% |
| Interquartile 75% (IQ3) | 14.9% | 12.9% |
| Interquartile Range (IQR) | 6.9% | 5.7% |
| Standard Deviation (Sample) | 6.9% | 4.4% |
| Standard Deviation (Population) | 6.9% | 4.4% |
Similar Demographics by Master's Degree
Demographics Similar to French Canadians by Master's Degree
In terms of master's degree, the demographic groups most similar to French Canadians are Immigrants from Somalia (14.1%, a difference of 0.25%), Immigrants from Trinidad and Tobago (14.1%, a difference of 0.25%), Immigrants from Vietnam (14.1%, a difference of 0.32%), Norwegian (14.0%, a difference of 0.35%), and German (14.0%, a difference of 0.50%).
| Demographics | Rating | Rank | Master's Degree |
| Somalis | 18.0 /100 | #211 | Poor 14.2% |
| Spanish | 17.8 /100 | #212 | Poor 14.2% |
| Immigrants | Thailand | 17.0 /100 | #213 | Poor 14.2% |
| Finns | 16.9 /100 | #214 | Poor 14.2% |
| Immigrants | Vietnam | 16.1 /100 | #215 | Poor 14.1% |
| Immigrants | Somalia | 15.8 /100 | #216 | Poor 14.1% |
| Immigrants | Trinidad and Tobago | 15.8 /100 | #217 | Poor 14.1% |
| French Canadians | 14.9 /100 | #218 | Poor 14.1% |
| Norwegians | 13.6 /100 | #219 | Poor 14.0% |
| Germans | 13.1 /100 | #220 | Poor 14.0% |
| Koreans | 12.7 /100 | #221 | Poor 14.0% |
| Ecuadorians | 12.6 /100 | #222 | Poor 14.0% |
| Immigrants | South Eastern Asia | 11.9 /100 | #223 | Poor 14.0% |
| Immigrants | Grenada | 11.8 /100 | #224 | Poor 14.0% |
| Portuguese | 11.2 /100 | #225 | Poor 13.9% |
Demographics Similar to Salvadorans by Master's Degree
In terms of master's degree, the demographic groups most similar to Salvadorans are Central American (12.2%, a difference of 0.13%), Haitian (12.1%, a difference of 0.59%), Comanche (12.1%, a difference of 0.64%), Blackfeet (12.1%, a difference of 0.74%), and Native Hawaiian (12.3%, a difference of 0.78%).
| Demographics | Rating | Rank | Master's Degree |
| Central American Indians | 0.5 /100 | #263 | Tragic 12.4% |
| Belizeans | 0.5 /100 | #264 | Tragic 12.4% |
| Immigrants | Fiji | 0.5 /100 | #265 | Tragic 12.4% |
| Bahamians | 0.5 /100 | #266 | Tragic 12.4% |
| Americans | 0.4 /100 | #267 | Tragic 12.3% |
| Native Hawaiians | 0.4 /100 | #268 | Tragic 12.3% |
| Central Americans | 0.3 /100 | #269 | Tragic 12.2% |
| Salvadorans | 0.3 /100 | #270 | Tragic 12.2% |
| Haitians | 0.3 /100 | #271 | Tragic 12.1% |
| Comanche | 0.3 /100 | #272 | Tragic 12.1% |
| Blackfeet | 0.3 /100 | #273 | Tragic 12.1% |
| Cape Verdeans | 0.3 /100 | #274 | Tragic 12.1% |
| Cubans | 0.3 /100 | #275 | Tragic 12.1% |
| Blacks/African Americans | 0.3 /100 | #276 | Tragic 12.1% |
| Immigrants | Caribbean | 0.3 /100 | #277 | Tragic 12.1% |