French Canadian vs Immigrants from Asia Master's Degree
COMPARE
French Canadian
Immigrants from Asia
Master's Degree
Master's Degree Comparison
French Canadians
Immigrants from Asia
14.1%
MASTER'S DEGREE
14.9/ 100
METRIC RATING
218th/ 347
METRIC RANK
18.4%
MASTER'S DEGREE
99.9/ 100
METRIC RATING
57th/ 347
METRIC RANK
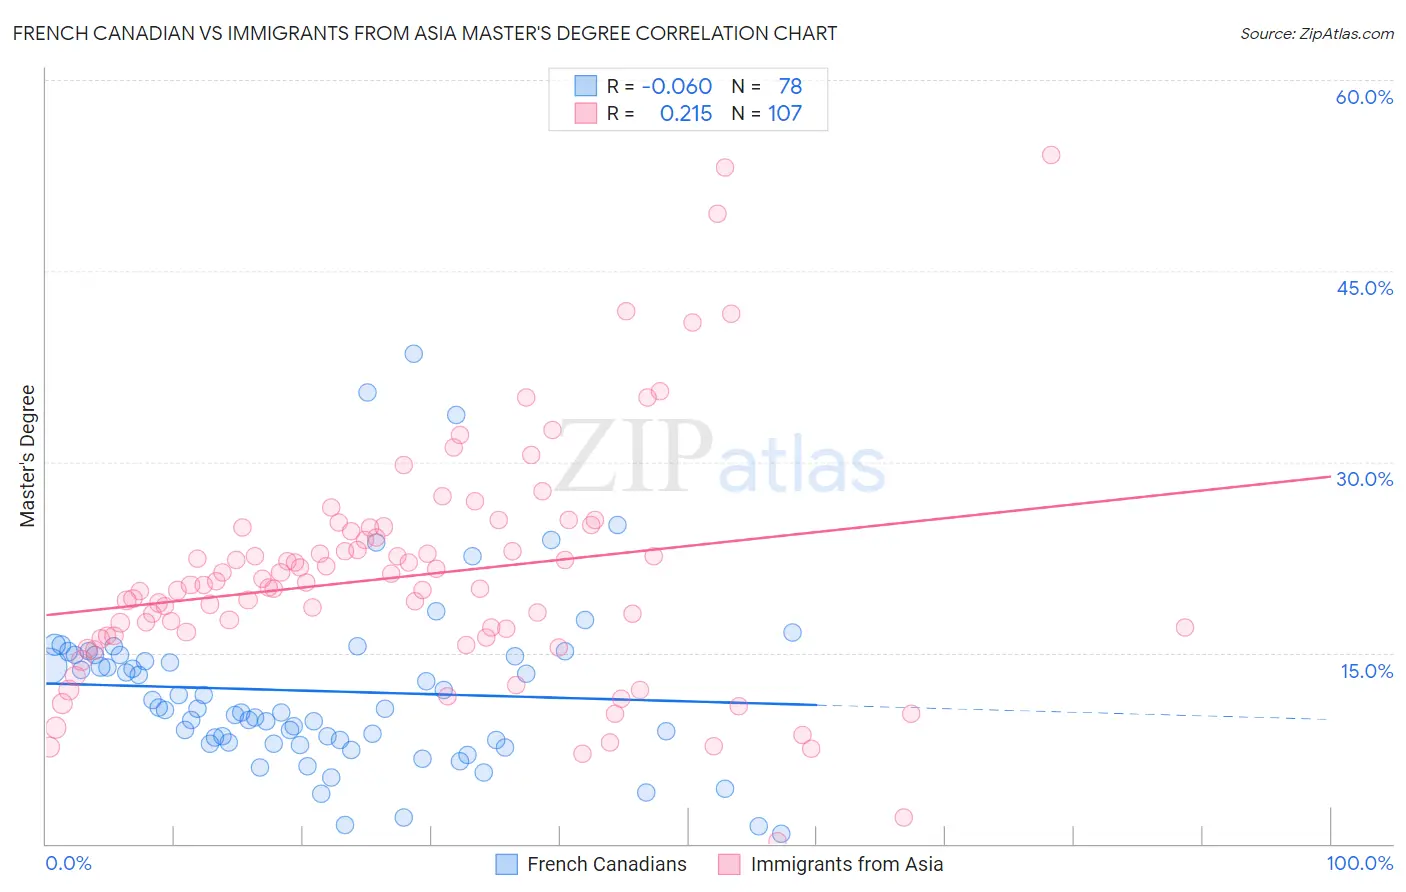
French Canadian vs Immigrants from Asia Master's Degree Correlation Chart
The statistical analysis conducted on geographies consisting of 502,359,495 people shows a slight negative correlation between the proportion of French Canadians and percentage of population with at least master's degree education in the United States with a correlation coefficient (R) of -0.060 and weighted average of 14.1%. Similarly, the statistical analysis conducted on geographies consisting of 548,687,564 people shows a weak positive correlation between the proportion of Immigrants from Asia and percentage of population with at least master's degree education in the United States with a correlation coefficient (R) of 0.215 and weighted average of 18.4%, a difference of 30.7%.
Master's Degree Correlation Summary
| Measurement | French Canadian | Immigrants from Asia |
| Minimum | 0.81% | 0.15% |
| Maximum | 38.5% | 54.1% |
| Range | 37.6% | 54.0% |
| Mean | 12.0% | 21.0% |
| Median | 10.6% | 20.3% |
| Interquartile 25% (IQ1) | 8.0% | 16.3% |
| Interquartile 75% (IQ3) | 14.9% | 24.5% |
| Interquartile Range (IQR) | 6.9% | 8.2% |
| Standard Deviation (Sample) | 6.9% | 9.2% |
| Standard Deviation (Population) | 6.9% | 9.2% |
Similar Demographics by Master's Degree
Demographics Similar to French Canadians by Master's Degree
In terms of master's degree, the demographic groups most similar to French Canadians are Immigrants from Somalia (14.1%, a difference of 0.25%), Immigrants from Trinidad and Tobago (14.1%, a difference of 0.25%), Immigrants from Vietnam (14.1%, a difference of 0.32%), Norwegian (14.0%, a difference of 0.35%), and German (14.0%, a difference of 0.50%).
| Demographics | Rating | Rank | Master's Degree |
| Somalis | 18.0 /100 | #211 | Poor 14.2% |
| Spanish | 17.8 /100 | #212 | Poor 14.2% |
| Immigrants | Thailand | 17.0 /100 | #213 | Poor 14.2% |
| Finns | 16.9 /100 | #214 | Poor 14.2% |
| Immigrants | Vietnam | 16.1 /100 | #215 | Poor 14.1% |
| Immigrants | Somalia | 15.8 /100 | #216 | Poor 14.1% |
| Immigrants | Trinidad and Tobago | 15.8 /100 | #217 | Poor 14.1% |
| French Canadians | 14.9 /100 | #218 | Poor 14.1% |
| Norwegians | 13.6 /100 | #219 | Poor 14.0% |
| Germans | 13.1 /100 | #220 | Poor 14.0% |
| Koreans | 12.7 /100 | #221 | Poor 14.0% |
| Ecuadorians | 12.6 /100 | #222 | Poor 14.0% |
| Immigrants | South Eastern Asia | 11.9 /100 | #223 | Poor 14.0% |
| Immigrants | Grenada | 11.8 /100 | #224 | Poor 14.0% |
| Portuguese | 11.2 /100 | #225 | Poor 13.9% |
Demographics Similar to Immigrants from Asia by Master's Degree
In terms of master's degree, the demographic groups most similar to Immigrants from Asia are Australian (18.4%, a difference of 0.13%), Asian (18.4%, a difference of 0.14%), Immigrants from Serbia (18.5%, a difference of 0.36%), Immigrants from Lithuania (18.5%, a difference of 0.39%), and Immigrants from Bulgaria (18.3%, a difference of 0.57%).
| Demographics | Rating | Rank | Master's Degree |
| Bulgarians | 100.0 /100 | #50 | Exceptional 18.8% |
| Immigrants | South Africa | 100.0 /100 | #51 | Exceptional 18.8% |
| Immigrants | Kuwait | 100.0 /100 | #52 | Exceptional 18.6% |
| Immigrants | Czechoslovakia | 99.9 /100 | #53 | Exceptional 18.5% |
| Immigrants | Lithuania | 99.9 /100 | #54 | Exceptional 18.5% |
| Immigrants | Serbia | 99.9 /100 | #55 | Exceptional 18.5% |
| Asians | 99.9 /100 | #56 | Exceptional 18.4% |
| Immigrants | Asia | 99.9 /100 | #57 | Exceptional 18.4% |
| Australians | 99.9 /100 | #58 | Exceptional 18.4% |
| Immigrants | Bulgaria | 99.9 /100 | #59 | Exceptional 18.3% |
| New Zealanders | 99.9 /100 | #60 | Exceptional 18.3% |
| Immigrants | Europe | 99.9 /100 | #61 | Exceptional 18.2% |
| Argentineans | 99.9 /100 | #62 | Exceptional 18.2% |
| Immigrants | Netherlands | 99.9 /100 | #63 | Exceptional 18.1% |
| South Africans | 99.9 /100 | #64 | Exceptional 18.1% |