Finnish vs Vietnamese 10th Grade
COMPARE
Finnish
Vietnamese
10th Grade
10th Grade Comparison
Finns
Vietnamese
95.8%
10TH GRADE
100.0/ 100
METRIC RATING
9th/ 347
METRIC RANK
90.9%
10TH GRADE
0.0/ 100
METRIC RATING
310th/ 347
METRIC RANK
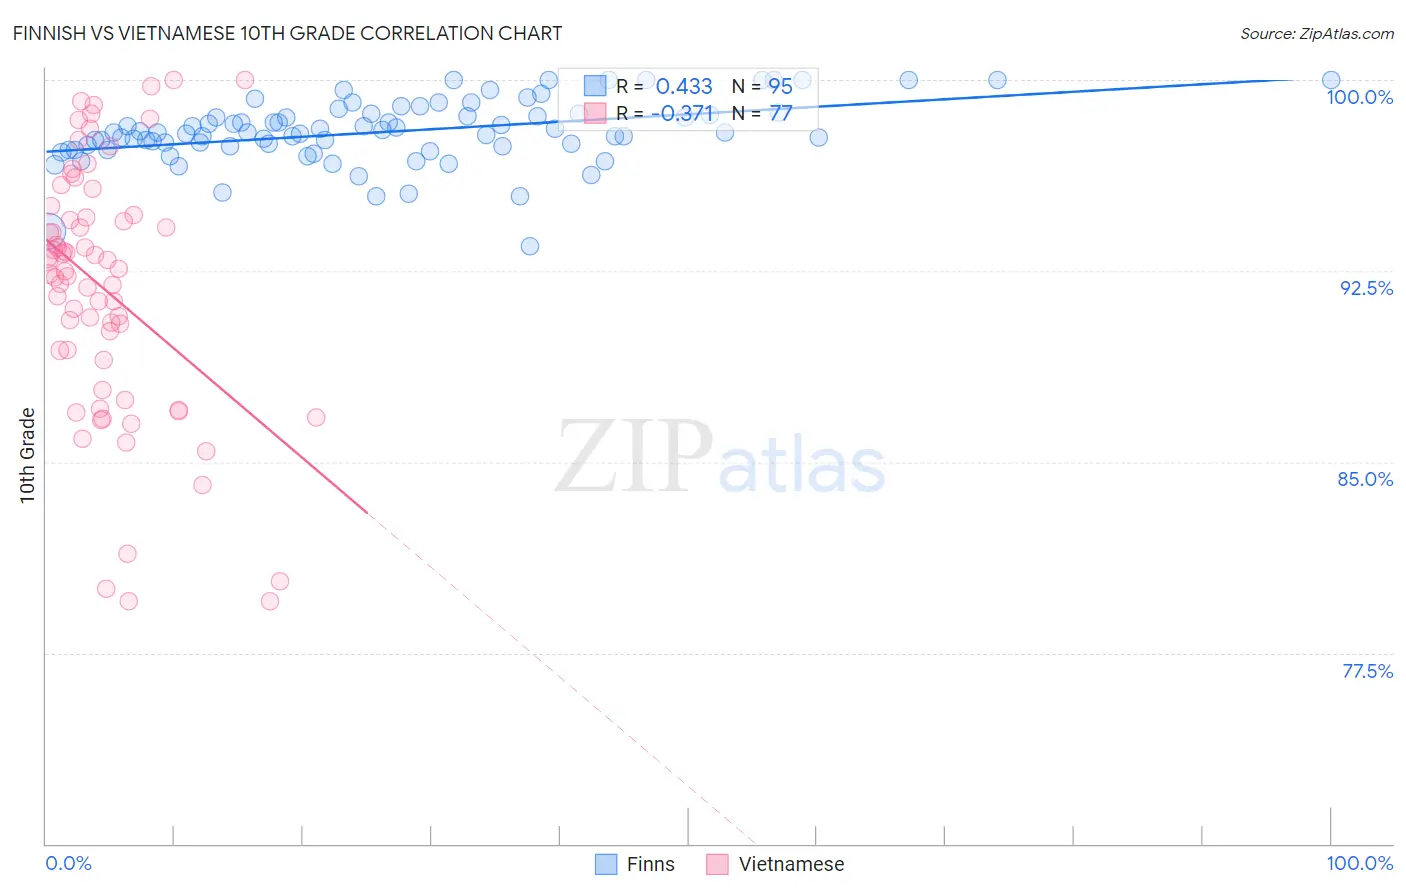
Finnish vs Vietnamese 10th Grade Correlation Chart
The statistical analysis conducted on geographies consisting of 404,676,377 people shows a moderate positive correlation between the proportion of Finns and percentage of population with at least 10th grade education in the United States with a correlation coefficient (R) of 0.433 and weighted average of 95.8%. Similarly, the statistical analysis conducted on geographies consisting of 170,728,240 people shows a mild negative correlation between the proportion of Vietnamese and percentage of population with at least 10th grade education in the United States with a correlation coefficient (R) of -0.371 and weighted average of 90.9%, a difference of 5.3%.
10th Grade Correlation Summary
| Measurement | Finnish | Vietnamese |
| Minimum | 93.5% | 79.5% |
| Maximum | 100.0% | 100.0% |
| Range | 6.5% | 20.5% |
| Mean | 98.0% | 91.8% |
| Median | 97.9% | 92.5% |
| Interquartile 25% (IQ1) | 97.4% | 88.4% |
| Interquartile 75% (IQ3) | 98.7% | 94.6% |
| Interquartile Range (IQR) | 1.3% | 6.2% |
| Standard Deviation (Sample) | 1.3% | 5.0% |
| Standard Deviation (Population) | 1.3% | 4.9% |
Similar Demographics by 10th Grade
Demographics Similar to Finns by 10th Grade
In terms of 10th grade, the demographic groups most similar to Finns are Croatian (95.7%, a difference of 0.020%), Lithuanian (95.8%, a difference of 0.060%), Danish (95.7%, a difference of 0.060%), German (95.8%, a difference of 0.070%), and Polish (95.8%, a difference of 0.080%).
| Demographics | Rating | Rank | 10th Grade |
| Slovaks | 100.0 /100 | #2 | Exceptional 96.0% |
| Slovenes | 100.0 /100 | #3 | Exceptional 95.9% |
| Swedes | 100.0 /100 | #4 | Exceptional 95.9% |
| Carpatho Rusyns | 100.0 /100 | #5 | Exceptional 95.9% |
| Poles | 100.0 /100 | #6 | Exceptional 95.8% |
| Germans | 100.0 /100 | #7 | Exceptional 95.8% |
| Lithuanians | 100.0 /100 | #8 | Exceptional 95.8% |
| Finns | 100.0 /100 | #9 | Exceptional 95.8% |
| Croatians | 100.0 /100 | #10 | Exceptional 95.7% |
| Danes | 100.0 /100 | #11 | Exceptional 95.7% |
| Tlingit-Haida | 100.0 /100 | #12 | Exceptional 95.7% |
| English | 100.0 /100 | #13 | Exceptional 95.6% |
| Tsimshian | 100.0 /100 | #14 | Exceptional 95.6% |
| Irish | 100.0 /100 | #15 | Exceptional 95.6% |
| Scottish | 100.0 /100 | #16 | Exceptional 95.6% |
Demographics Similar to Vietnamese by 10th Grade
In terms of 10th grade, the demographic groups most similar to Vietnamese are Immigrants from Cambodia (90.9%, a difference of 0.020%), Immigrants (91.0%, a difference of 0.040%), Immigrants from Bangladesh (91.0%, a difference of 0.080%), Immigrants from Fiji (91.0%, a difference of 0.090%), and Yaqui (91.1%, a difference of 0.15%).
| Demographics | Rating | Rank | 10th Grade |
| Immigrants | Vietnam | 0.0 /100 | #303 | Tragic 91.2% |
| Pima | 0.0 /100 | #304 | Tragic 91.2% |
| Immigrants | Dominica | 0.0 /100 | #305 | Tragic 91.1% |
| Yaqui | 0.0 /100 | #306 | Tragic 91.1% |
| Immigrants | Fiji | 0.0 /100 | #307 | Tragic 91.0% |
| Immigrants | Bangladesh | 0.0 /100 | #308 | Tragic 91.0% |
| Immigrants | Immigrants | 0.0 /100 | #309 | Tragic 91.0% |
| Vietnamese | 0.0 /100 | #310 | Tragic 90.9% |
| Immigrants | Cambodia | 0.0 /100 | #311 | Tragic 90.9% |
| Immigrants | Portugal | 0.0 /100 | #312 | Tragic 90.8% |
| Cape Verdeans | 0.0 /100 | #313 | Tragic 90.8% |
| Nepalese | 0.0 /100 | #314 | Tragic 90.7% |
| Immigrants | Caribbean | 0.0 /100 | #315 | Tragic 90.6% |
| Ecuadorians | 0.0 /100 | #316 | Tragic 90.6% |
| Immigrants | Ecuador | 0.0 /100 | #317 | Tragic 90.4% |