Spanish vs Immigrants from Fiji 11th Grade
COMPARE
Spanish
Immigrants from Fiji
11th Grade
11th Grade Comparison
Spanish
Immigrants from Fiji
92.7%
11TH GRADE
66.2/ 100
METRIC RATING
164th/ 347
METRIC RANK
89.9%
11TH GRADE
0.0/ 100
METRIC RATING
298th/ 347
METRIC RANK
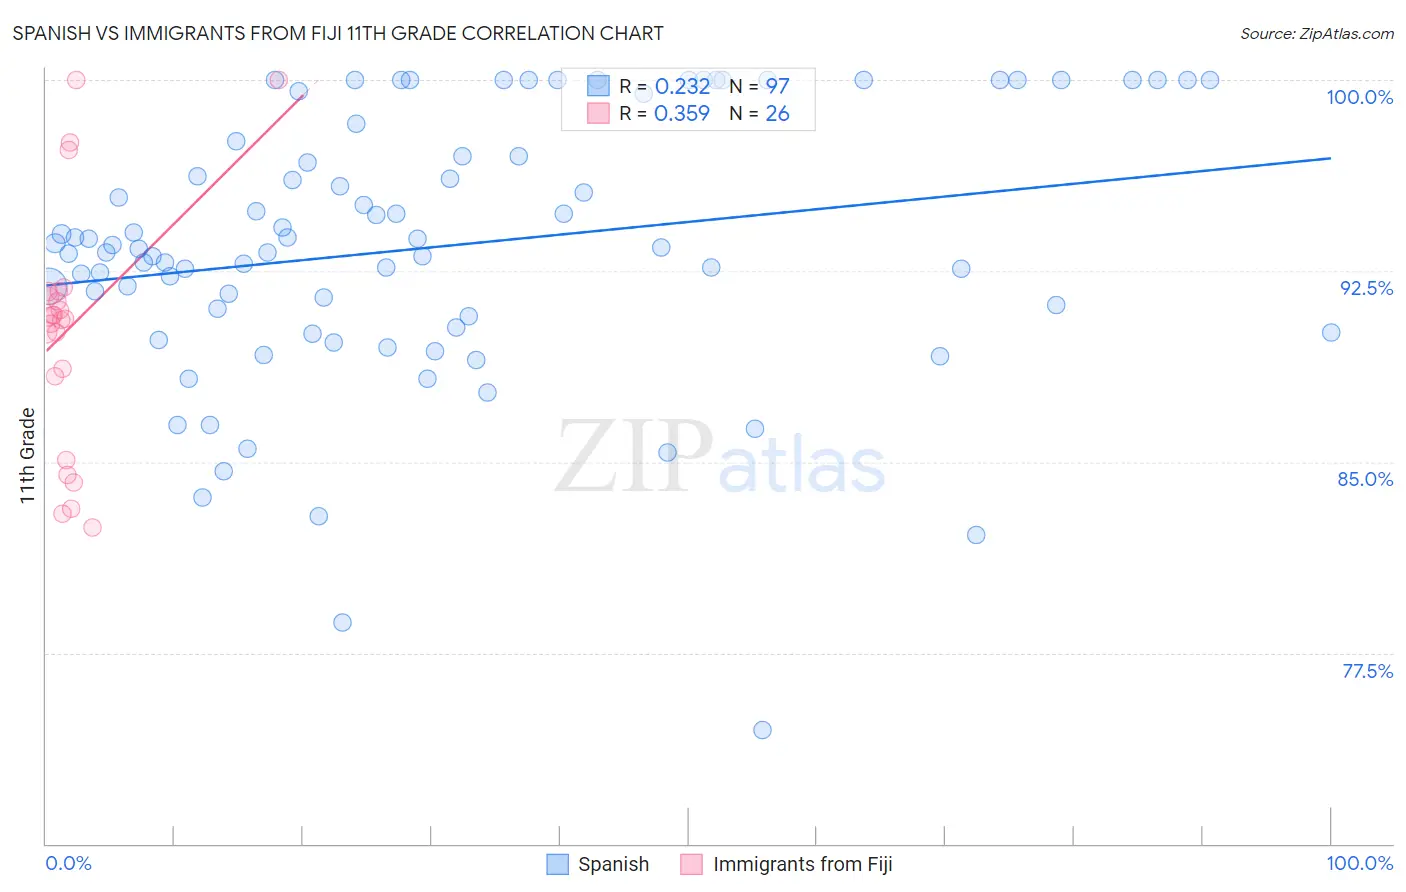
Spanish vs Immigrants from Fiji 11th Grade Correlation Chart
The statistical analysis conducted on geographies consisting of 422,188,828 people shows a weak positive correlation between the proportion of Spanish and percentage of population with at least 11th grade education in the United States with a correlation coefficient (R) of 0.232 and weighted average of 92.7%. Similarly, the statistical analysis conducted on geographies consisting of 93,756,204 people shows a mild positive correlation between the proportion of Immigrants from Fiji and percentage of population with at least 11th grade education in the United States with a correlation coefficient (R) of 0.359 and weighted average of 89.9%, a difference of 3.0%.
11th Grade Correlation Summary
| Measurement | Spanish | Immigrants from Fiji |
| Minimum | 74.4% | 82.4% |
| Maximum | 100.0% | 100.0% |
| Range | 25.6% | 17.6% |
| Mean | 93.5% | 90.3% |
| Median | 93.4% | 90.7% |
| Interquartile 25% (IQ1) | 90.5% | 88.4% |
| Interquartile 75% (IQ3) | 97.9% | 91.7% |
| Interquartile Range (IQR) | 7.5% | 3.3% |
| Standard Deviation (Sample) | 5.3% | 4.8% |
| Standard Deviation (Population) | 5.2% | 4.7% |
Similar Demographics by 11th Grade
Demographics Similar to Spanish by 11th Grade
In terms of 11th grade, the demographic groups most similar to Spanish are Nonimmigrants (92.7%, a difference of 0.0%), Paraguayan (92.7%, a difference of 0.030%), Immigrants from Iraq (92.6%, a difference of 0.030%), Immigrants from Argentina (92.7%, a difference of 0.040%), and Bermudan (92.6%, a difference of 0.040%).
| Demographics | Rating | Rank | 11th Grade |
| Immigrants | Eastern Asia | 72.6 /100 | #157 | Good 92.7% |
| Immigrants | Venezuela | 72.0 /100 | #158 | Good 92.7% |
| Americans | 71.7 /100 | #159 | Good 92.7% |
| Immigrants | Lebanon | 70.7 /100 | #160 | Good 92.7% |
| Immigrants | Argentina | 69.8 /100 | #161 | Good 92.7% |
| Paraguayans | 68.7 /100 | #162 | Good 92.7% |
| Immigrants | Nonimmigrants | 66.6 /100 | #163 | Good 92.7% |
| Spanish | 66.2 /100 | #164 | Good 92.7% |
| Immigrants | Iraq | 63.7 /100 | #165 | Good 92.6% |
| Bermudans | 62.3 /100 | #166 | Good 92.6% |
| Alsatians | 60.2 /100 | #167 | Good 92.6% |
| Sierra Leoneans | 58.7 /100 | #168 | Average 92.6% |
| Immigrants | Albania | 57.8 /100 | #169 | Average 92.6% |
| Immigrants | Northern Africa | 57.3 /100 | #170 | Average 92.6% |
| Laotians | 54.4 /100 | #171 | Average 92.6% |
Demographics Similar to Immigrants from Fiji by 11th Grade
In terms of 11th grade, the demographic groups most similar to Immigrants from Fiji are Japanese (89.9%, a difference of 0.030%), Immigrants from Haiti (89.9%, a difference of 0.040%), Guyanese (89.9%, a difference of 0.050%), Navajo (90.0%, a difference of 0.070%), and Fijian (90.0%, a difference of 0.11%).
| Demographics | Rating | Rank | 11th Grade |
| Haitians | 0.0 /100 | #291 | Tragic 90.3% |
| Cubans | 0.0 /100 | #292 | Tragic 90.2% |
| Natives/Alaskans | 0.0 /100 | #293 | Tragic 90.2% |
| Immigrants | Grenada | 0.0 /100 | #294 | Tragic 90.1% |
| Immigrants | Vietnam | 0.0 /100 | #295 | Tragic 90.0% |
| Fijians | 0.0 /100 | #296 | Tragic 90.0% |
| Navajo | 0.0 /100 | #297 | Tragic 90.0% |
| Immigrants | Fiji | 0.0 /100 | #298 | Tragic 89.9% |
| Japanese | 0.0 /100 | #299 | Tragic 89.9% |
| Immigrants | Haiti | 0.0 /100 | #300 | Tragic 89.9% |
| Guyanese | 0.0 /100 | #301 | Tragic 89.9% |
| Immigrants | Guyana | 0.0 /100 | #302 | Tragic 89.7% |
| Immigrants | Immigrants | 0.0 /100 | #303 | Tragic 89.7% |
| Yuman | 0.0 /100 | #304 | Tragic 89.7% |
| Immigrants | Cambodia | 0.0 /100 | #305 | Tragic 89.6% |