Finnish vs Immigrants from Canada 11th Grade
COMPARE
Finnish
Immigrants from Canada
11th Grade
11th Grade Comparison
Finns
Immigrants from Canada
94.7%
11TH GRADE
100.0/ 100
METRIC RATING
10th/ 347
METRIC RANK
94.0%
11TH GRADE
99.9/ 100
METRIC RATING
52nd/ 347
METRIC RANK
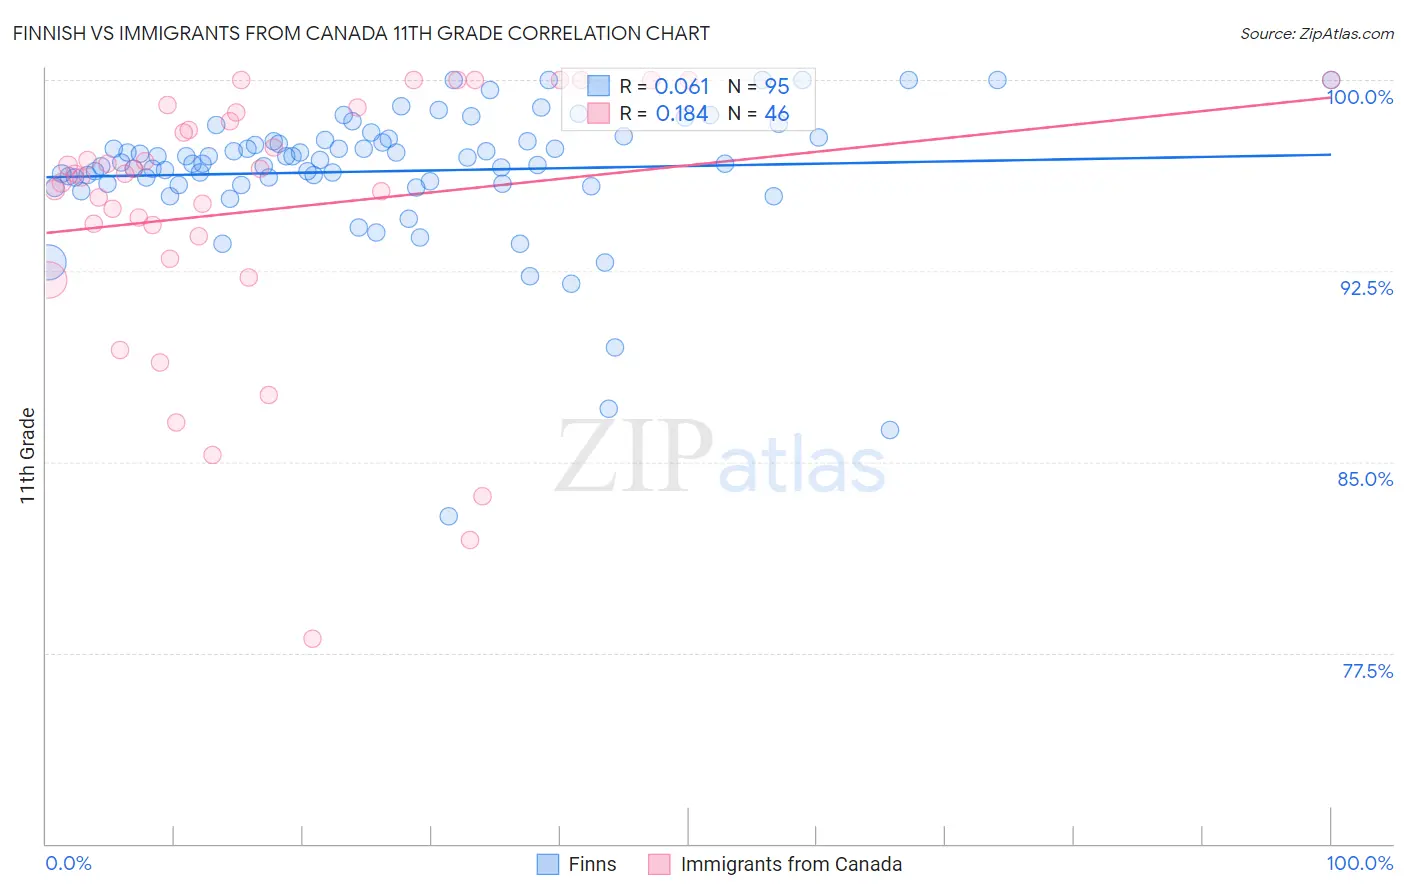
Finnish vs Immigrants from Canada 11th Grade Correlation Chart
The statistical analysis conducted on geographies consisting of 404,676,167 people shows a slight positive correlation between the proportion of Finns and percentage of population with at least 11th grade education in the United States with a correlation coefficient (R) of 0.061 and weighted average of 94.7%. Similarly, the statistical analysis conducted on geographies consisting of 459,397,067 people shows a poor positive correlation between the proportion of Immigrants from Canada and percentage of population with at least 11th grade education in the United States with a correlation coefficient (R) of 0.184 and weighted average of 94.0%, a difference of 0.68%.
11th Grade Correlation Summary
| Measurement | Finnish | Immigrants from Canada |
| Minimum | 82.9% | 78.1% |
| Maximum | 100.0% | 100.0% |
| Range | 17.1% | 21.9% |
| Mean | 96.4% | 94.9% |
| Median | 96.7% | 96.3% |
| Interquartile 25% (IQ1) | 95.9% | 93.9% |
| Interquartile 75% (IQ3) | 97.7% | 98.7% |
| Interquartile Range (IQR) | 1.7% | 4.9% |
| Standard Deviation (Sample) | 2.7% | 5.2% |
| Standard Deviation (Population) | 2.7% | 5.2% |
Similar Demographics by 11th Grade
Demographics Similar to Finns by 11th Grade
In terms of 11th grade, the demographic groups most similar to Finns are German (94.7%, a difference of 0.0%), Latvian (94.7%, a difference of 0.0%), Chinese (94.6%, a difference of 0.040%), Danish (94.7%, a difference of 0.050%), and Polish (94.8%, a difference of 0.090%).
| Demographics | Rating | Rank | 11th Grade |
| Slovenes | 100.0 /100 | #3 | Exceptional 94.9% |
| Slovaks | 100.0 /100 | #4 | Exceptional 94.9% |
| Carpatho Rusyns | 100.0 /100 | #5 | Exceptional 94.8% |
| Lithuanians | 100.0 /100 | #6 | Exceptional 94.8% |
| Poles | 100.0 /100 | #7 | Exceptional 94.8% |
| Croatians | 100.0 /100 | #8 | Exceptional 94.7% |
| Danes | 100.0 /100 | #9 | Exceptional 94.7% |
| Finns | 100.0 /100 | #10 | Exceptional 94.7% |
| Germans | 100.0 /100 | #11 | Exceptional 94.7% |
| Latvians | 100.0 /100 | #12 | Exceptional 94.7% |
| Chinese | 100.0 /100 | #13 | Exceptional 94.6% |
| Eastern Europeans | 100.0 /100 | #14 | Exceptional 94.6% |
| Bulgarians | 100.0 /100 | #15 | Exceptional 94.5% |
| Immigrants | India | 100.0 /100 | #16 | Exceptional 94.5% |
| Luxembourgers | 100.0 /100 | #17 | Exceptional 94.5% |
Demographics Similar to Immigrants from Canada by 11th Grade
In terms of 11th grade, the demographic groups most similar to Immigrants from Canada are Turkish (94.0%, a difference of 0.010%), Immigrants from Australia (94.0%, a difference of 0.010%), Immigrants from North America (94.0%, a difference of 0.020%), Czechoslovakian (94.0%, a difference of 0.020%), and French Canadian (94.0%, a difference of 0.030%).
| Demographics | Rating | Rank | 11th Grade |
| Australians | 99.9 /100 | #45 | Exceptional 94.1% |
| Serbians | 99.9 /100 | #46 | Exceptional 94.1% |
| Filipinos | 99.9 /100 | #47 | Exceptional 94.1% |
| Macedonians | 99.9 /100 | #48 | Exceptional 94.1% |
| Slavs | 99.9 /100 | #49 | Exceptional 94.1% |
| French | 99.9 /100 | #50 | Exceptional 94.1% |
| Turks | 99.9 /100 | #51 | Exceptional 94.0% |
| Immigrants | Canada | 99.9 /100 | #52 | Exceptional 94.0% |
| Immigrants | Australia | 99.9 /100 | #53 | Exceptional 94.0% |
| Immigrants | North America | 99.9 /100 | #54 | Exceptional 94.0% |
| Czechoslovakians | 99.9 /100 | #55 | Exceptional 94.0% |
| French Canadians | 99.9 /100 | #56 | Exceptional 94.0% |
| New Zealanders | 99.9 /100 | #57 | Exceptional 94.0% |
| Iranians | 99.9 /100 | #58 | Exceptional 94.0% |
| Bhutanese | 99.8 /100 | #59 | Exceptional 94.0% |