Finnish vs Immigrants from Central America 11th Grade
COMPARE
Finnish
Immigrants from Central America
11th Grade
11th Grade Comparison
Finns
Immigrants from Central America
94.7%
11TH GRADE
100.0/ 100
METRIC RATING
10th/ 347
METRIC RANK
84.9%
11TH GRADE
0.0/ 100
METRIC RATING
345th/ 347
METRIC RANK
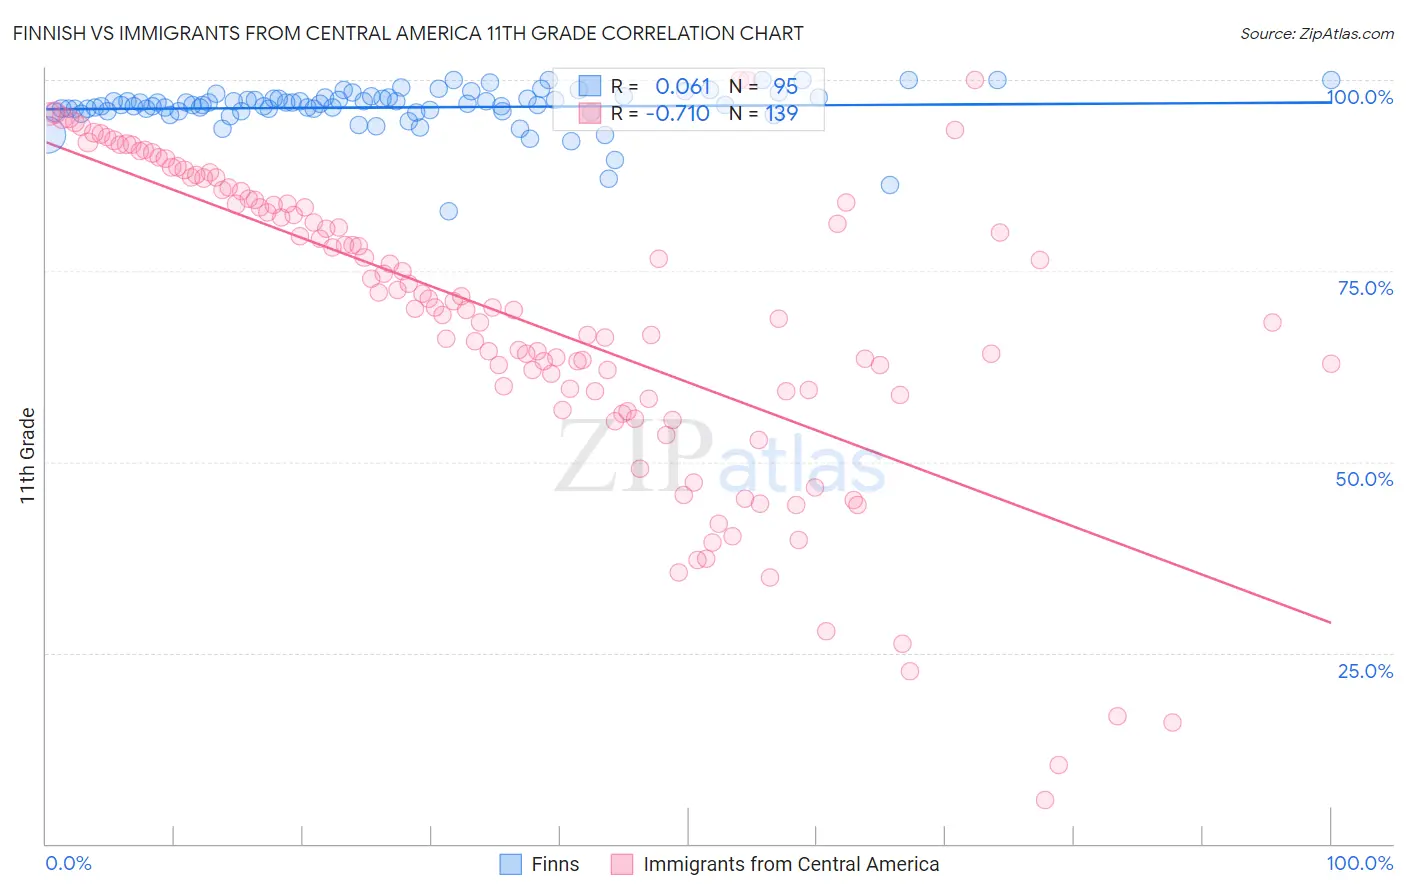
Finnish vs Immigrants from Central America 11th Grade Correlation Chart
The statistical analysis conducted on geographies consisting of 404,676,167 people shows a slight positive correlation between the proportion of Finns and percentage of population with at least 11th grade education in the United States with a correlation coefficient (R) of 0.061 and weighted average of 94.7%. Similarly, the statistical analysis conducted on geographies consisting of 536,553,482 people shows a strong negative correlation between the proportion of Immigrants from Central America and percentage of population with at least 11th grade education in the United States with a correlation coefficient (R) of -0.710 and weighted average of 84.9%, a difference of 11.4%.
11th Grade Correlation Summary
| Measurement | Finnish | Immigrants from Central America |
| Minimum | 82.9% | 5.7% |
| Maximum | 100.0% | 100.0% |
| Range | 17.1% | 94.3% |
| Mean | 96.4% | 69.1% |
| Median | 96.7% | 71.1% |
| Interquartile 25% (IQ1) | 95.9% | 59.2% |
| Interquartile 75% (IQ3) | 97.7% | 84.5% |
| Interquartile Range (IQR) | 1.7% | 25.2% |
| Standard Deviation (Sample) | 2.7% | 20.1% |
| Standard Deviation (Population) | 2.7% | 20.0% |
Similar Demographics by 11th Grade
Demographics Similar to Finns by 11th Grade
In terms of 11th grade, the demographic groups most similar to Finns are German (94.7%, a difference of 0.0%), Latvian (94.7%, a difference of 0.0%), Chinese (94.6%, a difference of 0.040%), Danish (94.7%, a difference of 0.050%), and Polish (94.8%, a difference of 0.090%).
| Demographics | Rating | Rank | 11th Grade |
| Slovenes | 100.0 /100 | #3 | Exceptional 94.9% |
| Slovaks | 100.0 /100 | #4 | Exceptional 94.9% |
| Carpatho Rusyns | 100.0 /100 | #5 | Exceptional 94.8% |
| Lithuanians | 100.0 /100 | #6 | Exceptional 94.8% |
| Poles | 100.0 /100 | #7 | Exceptional 94.8% |
| Croatians | 100.0 /100 | #8 | Exceptional 94.7% |
| Danes | 100.0 /100 | #9 | Exceptional 94.7% |
| Finns | 100.0 /100 | #10 | Exceptional 94.7% |
| Germans | 100.0 /100 | #11 | Exceptional 94.7% |
| Latvians | 100.0 /100 | #12 | Exceptional 94.7% |
| Chinese | 100.0 /100 | #13 | Exceptional 94.6% |
| Eastern Europeans | 100.0 /100 | #14 | Exceptional 94.6% |
| Bulgarians | 100.0 /100 | #15 | Exceptional 94.5% |
| Immigrants | India | 100.0 /100 | #16 | Exceptional 94.5% |
| Luxembourgers | 100.0 /100 | #17 | Exceptional 94.5% |
Demographics Similar to Immigrants from Central America by 11th Grade
In terms of 11th grade, the demographic groups most similar to Immigrants from Central America are Yakama (85.0%, a difference of 0.030%), Spanish American Indian (84.7%, a difference of 0.24%), Immigrants from El Salvador (85.3%, a difference of 0.43%), Immigrants from Mexico (84.5%, a difference of 0.54%), and Immigrants from Guatemala (85.8%, a difference of 1.0%).
| Demographics | Rating | Rank | 11th Grade |
| Immigrants | Yemen | 0.0 /100 | #333 | Tragic 87.1% |
| Houma | 0.0 /100 | #334 | Tragic 87.0% |
| Central Americans | 0.0 /100 | #335 | Tragic 86.9% |
| Immigrants | Dominican Republic | 0.0 /100 | #336 | Tragic 86.9% |
| Immigrants | Honduras | 0.0 /100 | #337 | Tragic 86.9% |
| Immigrants | Latin America | 0.0 /100 | #338 | Tragic 86.8% |
| Guatemalans | 0.0 /100 | #339 | Tragic 86.4% |
| Salvadorans | 0.0 /100 | #340 | Tragic 86.2% |
| Mexicans | 0.0 /100 | #341 | Tragic 86.1% |
| Immigrants | Guatemala | 0.0 /100 | #342 | Tragic 85.8% |
| Immigrants | El Salvador | 0.0 /100 | #343 | Tragic 85.3% |
| Yakama | 0.0 /100 | #344 | Tragic 85.0% |
| Immigrants | Central America | 0.0 /100 | #345 | Tragic 84.9% |
| Spanish American Indians | 0.0 /100 | #346 | Tragic 84.7% |
| Immigrants | Mexico | 0.0 /100 | #347 | Tragic 84.5% |