Finnish vs Immigrants from Czechoslovakia Professional Degree
COMPARE
Finnish
Immigrants from Czechoslovakia
Professional Degree
Professional Degree Comparison
Finns
Immigrants from Czechoslovakia
4.2%
PROFESSIONAL DEGREE
18.7/ 100
METRIC RATING
201st/ 347
METRIC RANK
5.8%
PROFESSIONAL DEGREE
100.0/ 100
METRIC RATING
50th/ 347
METRIC RANK
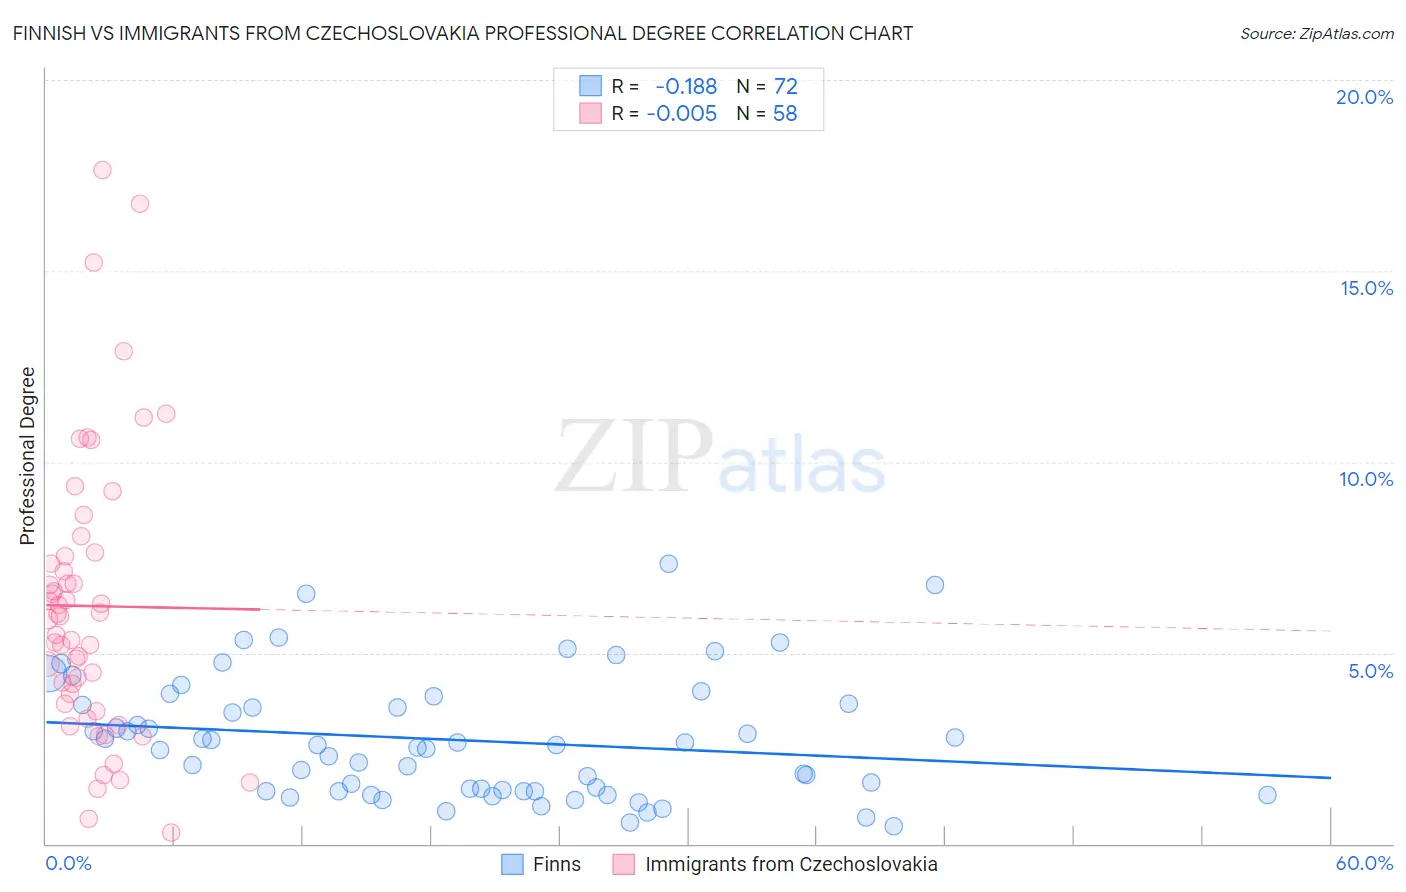
Finnish vs Immigrants from Czechoslovakia Professional Degree Correlation Chart
The statistical analysis conducted on geographies consisting of 403,408,940 people shows a poor negative correlation between the proportion of Finns and percentage of population with at least professional degree education in the United States with a correlation coefficient (R) of -0.188 and weighted average of 4.2%. Similarly, the statistical analysis conducted on geographies consisting of 195,354,883 people shows no correlation between the proportion of Immigrants from Czechoslovakia and percentage of population with at least professional degree education in the United States with a correlation coefficient (R) of -0.005 and weighted average of 5.8%, a difference of 39.5%.
Professional Degree Correlation Summary
| Measurement | Finnish | Immigrants from Czechoslovakia |
| Minimum | 0.47% | 0.28% |
| Maximum | 7.3% | 17.6% |
| Range | 6.9% | 17.4% |
| Mean | 2.7% | 6.2% |
| Median | 2.5% | 5.9% |
| Interquartile 25% (IQ1) | 1.4% | 3.7% |
| Interquartile 75% (IQ3) | 3.6% | 7.5% |
| Interquartile Range (IQR) | 2.3% | 3.9% |
| Standard Deviation (Sample) | 1.6% | 3.7% |
| Standard Deviation (Population) | 1.6% | 3.7% |
Similar Demographics by Professional Degree
Demographics Similar to Finns by Professional Degree
In terms of professional degree, the demographic groups most similar to Finns are Immigrants from North Macedonia (4.2%, a difference of 0.36%), Immigrants from Iraq (4.2%, a difference of 0.43%), Norwegian (4.2%, a difference of 0.44%), Panamanian (4.1%, a difference of 0.76%), and Barbadian (4.1%, a difference of 0.79%).
| Demographics | Rating | Rank | Professional Degree |
| Scandinavians | 25.8 /100 | #194 | Fair 4.2% |
| Nigerians | 24.6 /100 | #195 | Fair 4.2% |
| Spanish | 23.0 /100 | #196 | Fair 4.2% |
| Czechoslovakians | 22.4 /100 | #197 | Fair 4.2% |
| Immigrants | Middle Africa | 22.1 /100 | #198 | Fair 4.2% |
| Norwegians | 20.5 /100 | #199 | Fair 4.2% |
| Immigrants | North Macedonia | 20.2 /100 | #200 | Fair 4.2% |
| Finns | 18.7 /100 | #201 | Poor 4.2% |
| Immigrants | Iraq | 17.1 /100 | #202 | Poor 4.2% |
| Panamanians | 15.9 /100 | #203 | Poor 4.1% |
| Barbadians | 15.8 /100 | #204 | Poor 4.1% |
| Somalis | 14.8 /100 | #205 | Poor 4.1% |
| Yugoslavians | 13.4 /100 | #206 | Poor 4.1% |
| Sub-Saharan Africans | 12.8 /100 | #207 | Poor 4.1% |
| Immigrants | Somalia | 12.5 /100 | #208 | Poor 4.1% |
Demographics Similar to Immigrants from Czechoslovakia by Professional Degree
In terms of professional degree, the demographic groups most similar to Immigrants from Czechoslovakia are Immigrants from Greece (5.8%, a difference of 0.060%), Immigrants from Serbia (5.8%, a difference of 0.13%), Immigrants from Latvia (5.8%, a difference of 0.32%), Immigrants from Netherlands (5.8%, a difference of 0.36%), and Paraguayan (5.9%, a difference of 0.72%).
| Demographics | Rating | Rank | Professional Degree |
| Immigrants | Saudi Arabia | 100.0 /100 | #43 | Exceptional 5.9% |
| Argentineans | 100.0 /100 | #44 | Exceptional 5.9% |
| Immigrants | South Central Asia | 100.0 /100 | #45 | Exceptional 5.9% |
| Immigrants | Argentina | 100.0 /100 | #46 | Exceptional 5.9% |
| Australians | 100.0 /100 | #47 | Exceptional 5.9% |
| Paraguayans | 100.0 /100 | #48 | Exceptional 5.9% |
| Immigrants | Latvia | 100.0 /100 | #49 | Exceptional 5.8% |
| Immigrants | Czechoslovakia | 100.0 /100 | #50 | Exceptional 5.8% |
| Immigrants | Greece | 100.0 /100 | #51 | Exceptional 5.8% |
| Immigrants | Serbia | 100.0 /100 | #52 | Exceptional 5.8% |
| Immigrants | Netherlands | 100.0 /100 | #53 | Exceptional 5.8% |
| Immigrants | Kuwait | 100.0 /100 | #54 | Exceptional 5.7% |
| Immigrants | Western Europe | 100.0 /100 | #55 | Exceptional 5.7% |
| Immigrants | Malaysia | 100.0 /100 | #56 | Exceptional 5.7% |
| South Africans | 100.0 /100 | #57 | Exceptional 5.7% |