Immigrants from Philippines vs Immigrants from Czechoslovakia Professional Degree
COMPARE
Immigrants from Philippines
Immigrants from Czechoslovakia
Professional Degree
Professional Degree Comparison
Immigrants from Philippines
Immigrants from Czechoslovakia
3.9%
PROFESSIONAL DEGREE
4.1/ 100
METRIC RATING
233rd/ 347
METRIC RANK
5.8%
PROFESSIONAL DEGREE
100.0/ 100
METRIC RATING
50th/ 347
METRIC RANK
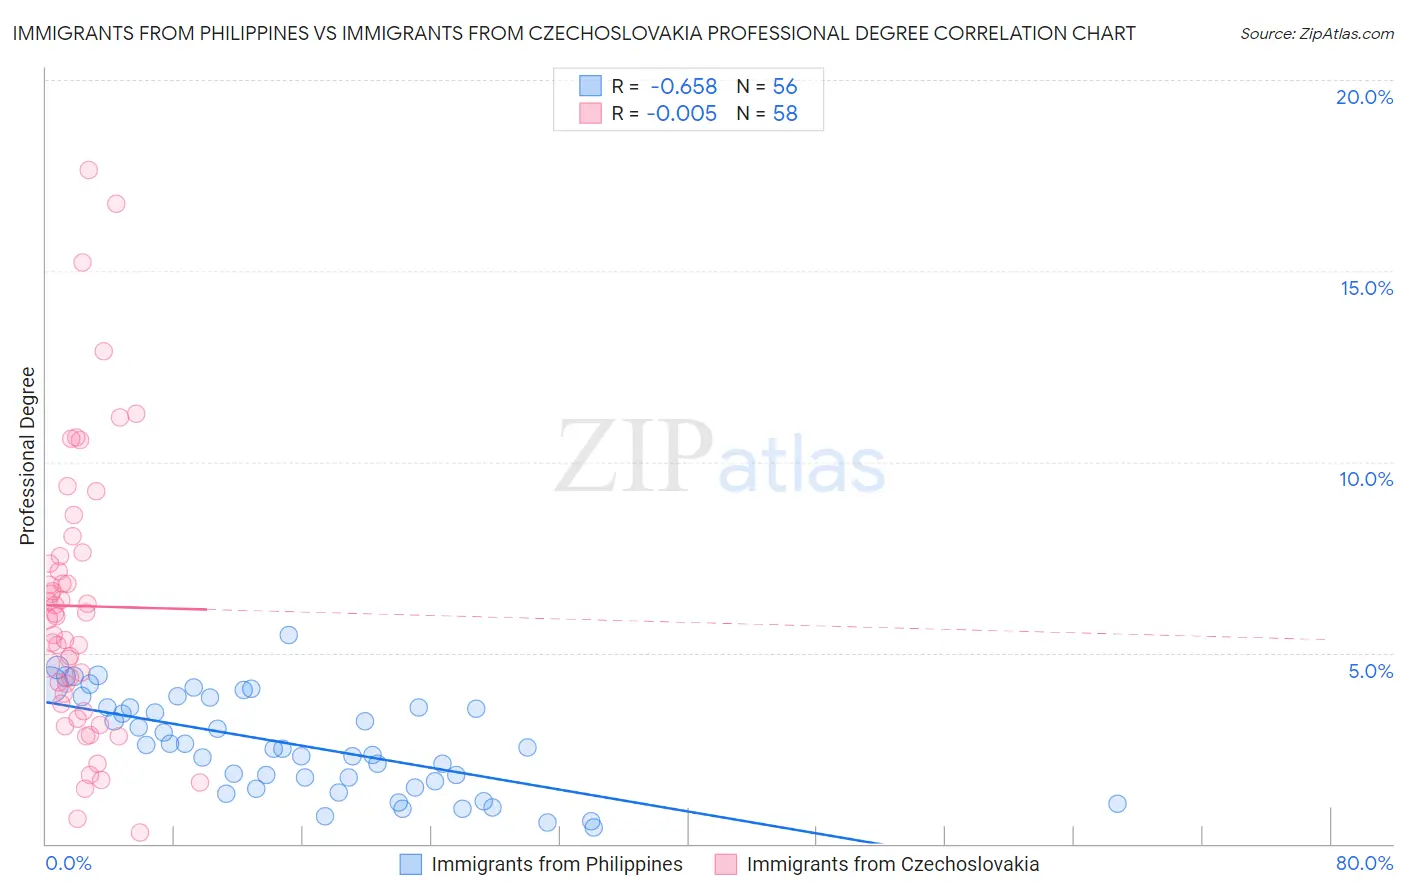
Immigrants from Philippines vs Immigrants from Czechoslovakia Professional Degree Correlation Chart
The statistical analysis conducted on geographies consisting of 469,653,358 people shows a significant negative correlation between the proportion of Immigrants from Philippines and percentage of population with at least professional degree education in the United States with a correlation coefficient (R) of -0.658 and weighted average of 3.9%. Similarly, the statistical analysis conducted on geographies consisting of 195,354,883 people shows no correlation between the proportion of Immigrants from Czechoslovakia and percentage of population with at least professional degree education in the United States with a correlation coefficient (R) of -0.005 and weighted average of 5.8%, a difference of 49.2%.
Professional Degree Correlation Summary
| Measurement | Immigrants from Philippines | Immigrants from Czechoslovakia |
| Minimum | 0.44% | 0.28% |
| Maximum | 5.5% | 17.6% |
| Range | 5.0% | 17.4% |
| Mean | 2.6% | 6.2% |
| Median | 2.5% | 5.9% |
| Interquartile 25% (IQ1) | 1.6% | 3.7% |
| Interquartile 75% (IQ3) | 3.6% | 7.5% |
| Interquartile Range (IQR) | 2.0% | 3.9% |
| Standard Deviation (Sample) | 1.3% | 3.7% |
| Standard Deviation (Population) | 1.2% | 3.7% |
Similar Demographics by Professional Degree
Demographics Similar to Immigrants from Philippines by Professional Degree
In terms of professional degree, the demographic groups most similar to Immigrants from Philippines are Nonimmigrants (3.9%, a difference of 0.050%), Immigrants from Barbados (3.9%, a difference of 0.050%), Cree (3.9%, a difference of 0.26%), Spanish American (3.9%, a difference of 0.28%), and Immigrants from Trinidad and Tobago (3.9%, a difference of 0.34%).
| Demographics | Rating | Rank | Professional Degree |
| German Russians | 6.1 /100 | #226 | Tragic 4.0% |
| Cubans | 5.9 /100 | #227 | Tragic 4.0% |
| Immigrants | West Indies | 5.6 /100 | #228 | Tragic 4.0% |
| Immigrants | Burma/Myanmar | 5.4 /100 | #229 | Tragic 3.9% |
| Nicaraguans | 5.1 /100 | #230 | Tragic 3.9% |
| Ecuadorians | 4.6 /100 | #231 | Tragic 3.9% |
| Cree | 4.3 /100 | #232 | Tragic 3.9% |
| Immigrants | Philippines | 4.1 /100 | #233 | Tragic 3.9% |
| Immigrants | Nonimmigrants | 4.0 /100 | #234 | Tragic 3.9% |
| Immigrants | Barbados | 4.0 /100 | #235 | Tragic 3.9% |
| Spanish Americans | 3.8 /100 | #236 | Tragic 3.9% |
| Immigrants | Trinidad and Tobago | 3.8 /100 | #237 | Tragic 3.9% |
| Colville | 2.6 /100 | #238 | Tragic 3.8% |
| British West Indians | 2.4 /100 | #239 | Tragic 3.8% |
| Immigrants | Ecuador | 2.3 /100 | #240 | Tragic 3.8% |
Demographics Similar to Immigrants from Czechoslovakia by Professional Degree
In terms of professional degree, the demographic groups most similar to Immigrants from Czechoslovakia are Immigrants from Greece (5.8%, a difference of 0.060%), Immigrants from Serbia (5.8%, a difference of 0.13%), Immigrants from Latvia (5.8%, a difference of 0.32%), Immigrants from Netherlands (5.8%, a difference of 0.36%), and Paraguayan (5.9%, a difference of 0.72%).
| Demographics | Rating | Rank | Professional Degree |
| Immigrants | Saudi Arabia | 100.0 /100 | #43 | Exceptional 5.9% |
| Argentineans | 100.0 /100 | #44 | Exceptional 5.9% |
| Immigrants | South Central Asia | 100.0 /100 | #45 | Exceptional 5.9% |
| Immigrants | Argentina | 100.0 /100 | #46 | Exceptional 5.9% |
| Australians | 100.0 /100 | #47 | Exceptional 5.9% |
| Paraguayans | 100.0 /100 | #48 | Exceptional 5.9% |
| Immigrants | Latvia | 100.0 /100 | #49 | Exceptional 5.8% |
| Immigrants | Czechoslovakia | 100.0 /100 | #50 | Exceptional 5.8% |
| Immigrants | Greece | 100.0 /100 | #51 | Exceptional 5.8% |
| Immigrants | Serbia | 100.0 /100 | #52 | Exceptional 5.8% |
| Immigrants | Netherlands | 100.0 /100 | #53 | Exceptional 5.8% |
| Immigrants | Kuwait | 100.0 /100 | #54 | Exceptional 5.7% |
| Immigrants | Western Europe | 100.0 /100 | #55 | Exceptional 5.7% |
| Immigrants | Malaysia | 100.0 /100 | #56 | Exceptional 5.7% |
| South Africans | 100.0 /100 | #57 | Exceptional 5.7% |