Finnish vs Immigrants from Laos Professional Degree
COMPARE
Finnish
Immigrants from Laos
Professional Degree
Professional Degree Comparison
Finns
Immigrants from Laos
4.2%
PROFESSIONAL DEGREE
18.7/ 100
METRIC RATING
201st/ 347
METRIC RANK
3.2%
PROFESSIONAL DEGREE
0.1/ 100
METRIC RATING
315th/ 347
METRIC RANK
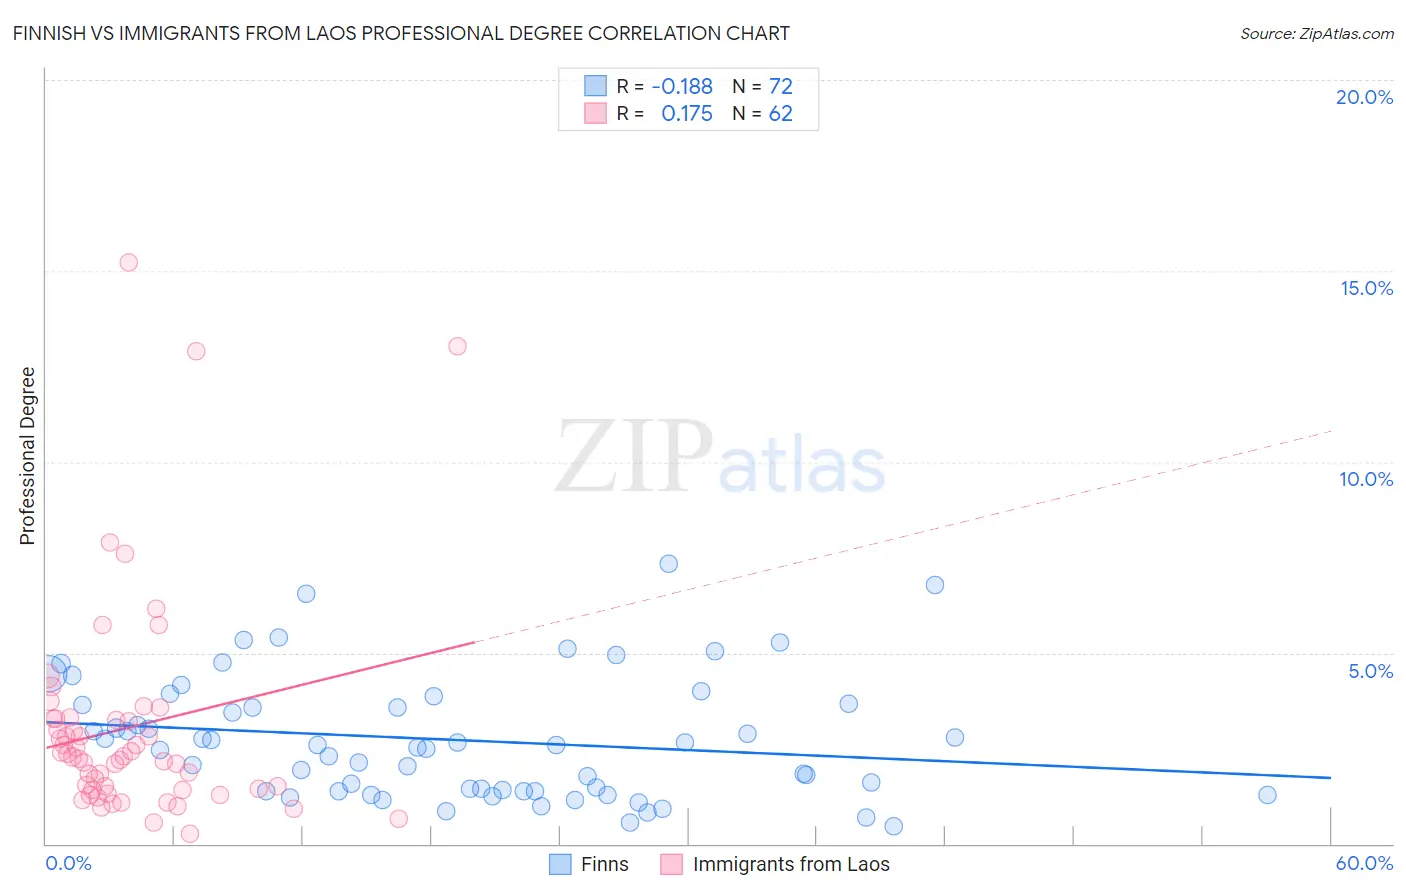
Finnish vs Immigrants from Laos Professional Degree Correlation Chart
The statistical analysis conducted on geographies consisting of 403,408,940 people shows a poor negative correlation between the proportion of Finns and percentage of population with at least professional degree education in the United States with a correlation coefficient (R) of -0.188 and weighted average of 4.2%. Similarly, the statistical analysis conducted on geographies consisting of 201,278,168 people shows a poor positive correlation between the proportion of Immigrants from Laos and percentage of population with at least professional degree education in the United States with a correlation coefficient (R) of 0.175 and weighted average of 3.2%, a difference of 28.6%.
Professional Degree Correlation Summary
| Measurement | Finnish | Immigrants from Laos |
| Minimum | 0.47% | 0.26% |
| Maximum | 7.3% | 15.2% |
| Range | 6.9% | 15.0% |
| Mean | 2.7% | 3.1% |
| Median | 2.5% | 2.3% |
| Interquartile 25% (IQ1) | 1.4% | 1.4% |
| Interquartile 75% (IQ3) | 3.6% | 3.3% |
| Interquartile Range (IQR) | 2.3% | 1.9% |
| Standard Deviation (Sample) | 1.6% | 2.9% |
| Standard Deviation (Population) | 1.6% | 2.9% |
Similar Demographics by Professional Degree
Demographics Similar to Finns by Professional Degree
In terms of professional degree, the demographic groups most similar to Finns are Immigrants from North Macedonia (4.2%, a difference of 0.36%), Immigrants from Iraq (4.2%, a difference of 0.43%), Norwegian (4.2%, a difference of 0.44%), Panamanian (4.1%, a difference of 0.76%), and Barbadian (4.1%, a difference of 0.79%).
| Demographics | Rating | Rank | Professional Degree |
| Scandinavians | 25.8 /100 | #194 | Fair 4.2% |
| Nigerians | 24.6 /100 | #195 | Fair 4.2% |
| Spanish | 23.0 /100 | #196 | Fair 4.2% |
| Czechoslovakians | 22.4 /100 | #197 | Fair 4.2% |
| Immigrants | Middle Africa | 22.1 /100 | #198 | Fair 4.2% |
| Norwegians | 20.5 /100 | #199 | Fair 4.2% |
| Immigrants | North Macedonia | 20.2 /100 | #200 | Fair 4.2% |
| Finns | 18.7 /100 | #201 | Poor 4.2% |
| Immigrants | Iraq | 17.1 /100 | #202 | Poor 4.2% |
| Panamanians | 15.9 /100 | #203 | Poor 4.1% |
| Barbadians | 15.8 /100 | #204 | Poor 4.1% |
| Somalis | 14.8 /100 | #205 | Poor 4.1% |
| Yugoslavians | 13.4 /100 | #206 | Poor 4.1% |
| Sub-Saharan Africans | 12.8 /100 | #207 | Poor 4.1% |
| Immigrants | Somalia | 12.5 /100 | #208 | Poor 4.1% |
Demographics Similar to Immigrants from Laos by Professional Degree
In terms of professional degree, the demographic groups most similar to Immigrants from Laos are Puerto Rican (3.2%, a difference of 0.010%), Nepalese (3.2%, a difference of 0.22%), Immigrants from Micronesia (3.2%, a difference of 0.25%), Choctaw (3.2%, a difference of 0.50%), and Mexican American Indian (3.3%, a difference of 0.68%).
| Demographics | Rating | Rank | Professional Degree |
| Shoshone | 0.1 /100 | #308 | Tragic 3.3% |
| Pima | 0.1 /100 | #309 | Tragic 3.3% |
| Immigrants | Latin America | 0.1 /100 | #310 | Tragic 3.3% |
| Cherokee | 0.1 /100 | #311 | Tragic 3.3% |
| Sioux | 0.1 /100 | #312 | Tragic 3.3% |
| Yuman | 0.1 /100 | #313 | Tragic 3.3% |
| Mexican American Indians | 0.1 /100 | #314 | Tragic 3.3% |
| Immigrants | Laos | 0.1 /100 | #315 | Tragic 3.2% |
| Puerto Ricans | 0.1 /100 | #316 | Tragic 3.2% |
| Nepalese | 0.1 /100 | #317 | Tragic 3.2% |
| Immigrants | Micronesia | 0.1 /100 | #318 | Tragic 3.2% |
| Choctaw | 0.1 /100 | #319 | Tragic 3.2% |
| Seminole | 0.1 /100 | #320 | Tragic 3.2% |
| Tsimshian | 0.0 /100 | #321 | Tragic 3.2% |
| Hispanics or Latinos | 0.0 /100 | #322 | Tragic 3.2% |