Seminole vs Immigrants from Czechoslovakia Professional Degree
COMPARE
Seminole
Immigrants from Czechoslovakia
Professional Degree
Professional Degree Comparison
Seminole
Immigrants from Czechoslovakia
3.2%
PROFESSIONAL DEGREE
0.1/ 100
METRIC RATING
320th/ 347
METRIC RANK
5.8%
PROFESSIONAL DEGREE
100.0/ 100
METRIC RATING
50th/ 347
METRIC RANK
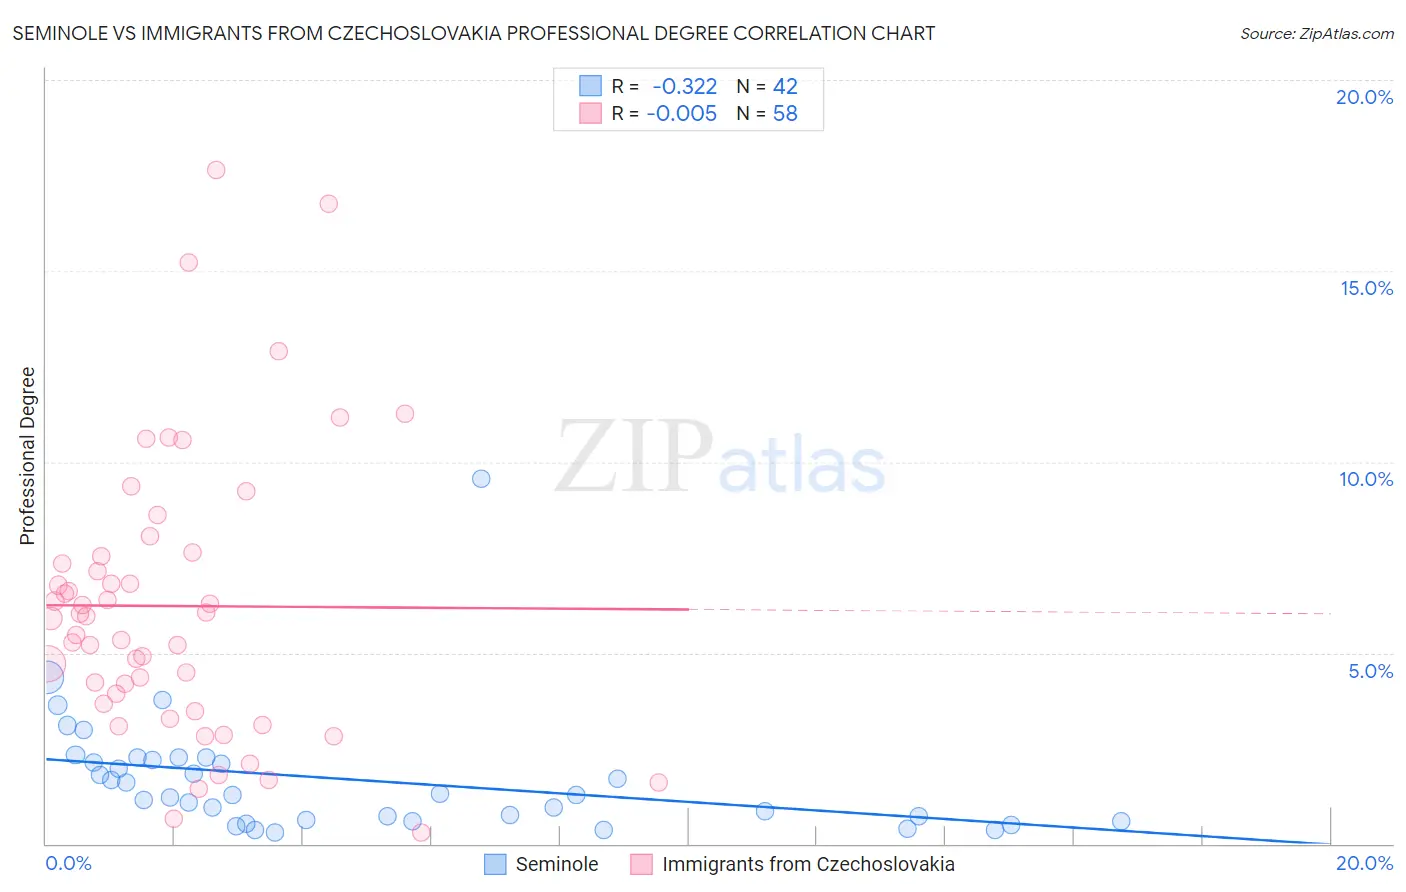
Seminole vs Immigrants from Czechoslovakia Professional Degree Correlation Chart
The statistical analysis conducted on geographies consisting of 118,144,737 people shows a mild negative correlation between the proportion of Seminole and percentage of population with at least professional degree education in the United States with a correlation coefficient (R) of -0.322 and weighted average of 3.2%. Similarly, the statistical analysis conducted on geographies consisting of 195,354,883 people shows no correlation between the proportion of Immigrants from Czechoslovakia and percentage of population with at least professional degree education in the United States with a correlation coefficient (R) of -0.005 and weighted average of 5.8%, a difference of 82.3%.
Professional Degree Correlation Summary
| Measurement | Seminole | Immigrants from Czechoslovakia |
| Minimum | 0.30% | 0.28% |
| Maximum | 9.6% | 17.6% |
| Range | 9.3% | 17.4% |
| Mean | 1.7% | 6.2% |
| Median | 1.3% | 5.9% |
| Interquartile 25% (IQ1) | 0.61% | 3.7% |
| Interquartile 75% (IQ3) | 2.2% | 7.5% |
| Interquartile Range (IQR) | 1.6% | 3.9% |
| Standard Deviation (Sample) | 1.6% | 3.7% |
| Standard Deviation (Population) | 1.6% | 3.7% |
Similar Demographics by Professional Degree
Demographics Similar to Seminole by Professional Degree
In terms of professional degree, the demographic groups most similar to Seminole are Tsimshian (3.2%, a difference of 0.36%), Hispanic or Latino (3.2%, a difference of 0.72%), Inupiat (3.2%, a difference of 0.80%), Crow (3.2%, a difference of 1.1%), and Choctaw (3.2%, a difference of 1.1%).
| Demographics | Rating | Rank | Professional Degree |
| Yuman | 0.1 /100 | #313 | Tragic 3.3% |
| Mexican American Indians | 0.1 /100 | #314 | Tragic 3.3% |
| Immigrants | Laos | 0.1 /100 | #315 | Tragic 3.2% |
| Puerto Ricans | 0.1 /100 | #316 | Tragic 3.2% |
| Nepalese | 0.1 /100 | #317 | Tragic 3.2% |
| Immigrants | Micronesia | 0.1 /100 | #318 | Tragic 3.2% |
| Choctaw | 0.1 /100 | #319 | Tragic 3.2% |
| Seminole | 0.1 /100 | #320 | Tragic 3.2% |
| Tsimshian | 0.0 /100 | #321 | Tragic 3.2% |
| Hispanics or Latinos | 0.0 /100 | #322 | Tragic 3.2% |
| Inupiat | 0.0 /100 | #323 | Tragic 3.2% |
| Crow | 0.0 /100 | #324 | Tragic 3.2% |
| Yaqui | 0.0 /100 | #325 | Tragic 3.2% |
| Menominee | 0.0 /100 | #326 | Tragic 3.1% |
| Dutch West Indians | 0.0 /100 | #327 | Tragic 3.1% |
Demographics Similar to Immigrants from Czechoslovakia by Professional Degree
In terms of professional degree, the demographic groups most similar to Immigrants from Czechoslovakia are Immigrants from Greece (5.8%, a difference of 0.060%), Immigrants from Serbia (5.8%, a difference of 0.13%), Immigrants from Latvia (5.8%, a difference of 0.32%), Immigrants from Netherlands (5.8%, a difference of 0.36%), and Paraguayan (5.9%, a difference of 0.72%).
| Demographics | Rating | Rank | Professional Degree |
| Immigrants | Saudi Arabia | 100.0 /100 | #43 | Exceptional 5.9% |
| Argentineans | 100.0 /100 | #44 | Exceptional 5.9% |
| Immigrants | South Central Asia | 100.0 /100 | #45 | Exceptional 5.9% |
| Immigrants | Argentina | 100.0 /100 | #46 | Exceptional 5.9% |
| Australians | 100.0 /100 | #47 | Exceptional 5.9% |
| Paraguayans | 100.0 /100 | #48 | Exceptional 5.9% |
| Immigrants | Latvia | 100.0 /100 | #49 | Exceptional 5.8% |
| Immigrants | Czechoslovakia | 100.0 /100 | #50 | Exceptional 5.8% |
| Immigrants | Greece | 100.0 /100 | #51 | Exceptional 5.8% |
| Immigrants | Serbia | 100.0 /100 | #52 | Exceptional 5.8% |
| Immigrants | Netherlands | 100.0 /100 | #53 | Exceptional 5.8% |
| Immigrants | Kuwait | 100.0 /100 | #54 | Exceptional 5.7% |
| Immigrants | Western Europe | 100.0 /100 | #55 | Exceptional 5.7% |
| Immigrants | Malaysia | 100.0 /100 | #56 | Exceptional 5.7% |
| South Africans | 100.0 /100 | #57 | Exceptional 5.7% |