Eastern European vs Immigrants from Czechoslovakia Professional Degree
COMPARE
Eastern European
Immigrants from Czechoslovakia
Professional Degree
Professional Degree Comparison
Eastern Europeans
Immigrants from Czechoslovakia
7.1%
PROFESSIONAL DEGREE
100.0/ 100
METRIC RATING
7th/ 347
METRIC RANK
5.8%
PROFESSIONAL DEGREE
100.0/ 100
METRIC RATING
50th/ 347
METRIC RANK
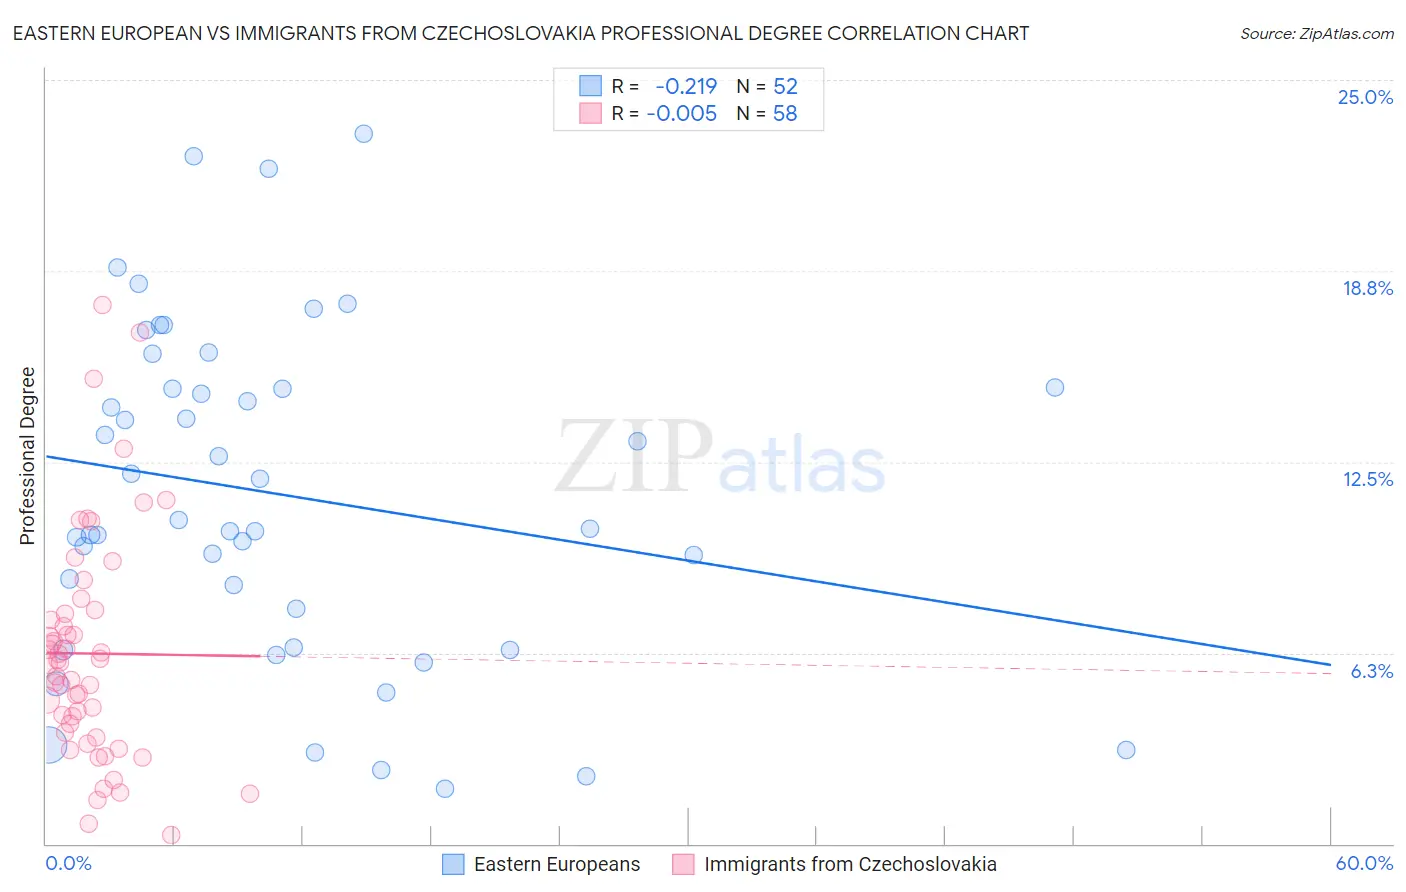
Eastern European vs Immigrants from Czechoslovakia Professional Degree Correlation Chart
The statistical analysis conducted on geographies consisting of 459,646,077 people shows a weak negative correlation between the proportion of Eastern Europeans and percentage of population with at least professional degree education in the United States with a correlation coefficient (R) of -0.219 and weighted average of 7.1%. Similarly, the statistical analysis conducted on geographies consisting of 195,354,883 people shows no correlation between the proportion of Immigrants from Czechoslovakia and percentage of population with at least professional degree education in the United States with a correlation coefficient (R) of -0.005 and weighted average of 5.8%, a difference of 21.9%.
Professional Degree Correlation Summary
| Measurement | Eastern European | Immigrants from Czechoslovakia |
| Minimum | 1.8% | 0.28% |
| Maximum | 23.2% | 17.6% |
| Range | 21.4% | 17.4% |
| Mean | 11.4% | 6.2% |
| Median | 10.5% | 5.9% |
| Interquartile 25% (IQ1) | 7.1% | 3.7% |
| Interquartile 75% (IQ3) | 14.9% | 7.5% |
| Interquartile Range (IQR) | 7.9% | 3.9% |
| Standard Deviation (Sample) | 5.4% | 3.7% |
| Standard Deviation (Population) | 5.4% | 3.7% |
Similar Demographics by Professional Degree
Demographics Similar to Eastern Europeans by Professional Degree
In terms of professional degree, the demographic groups most similar to Eastern Europeans are Immigrants from Switzerland (7.1%, a difference of 0.14%), Immigrants from Taiwan (7.1%, a difference of 0.33%), Immigrants from Belgium (7.0%, a difference of 2.1%), Cypriot (6.9%, a difference of 2.2%), and Israeli (6.9%, a difference of 2.3%).
| Demographics | Rating | Rank | Professional Degree |
| Immigrants | Israel | 100.0 /100 | #1 | Exceptional 7.9% |
| Immigrants | Singapore | 100.0 /100 | #2 | Exceptional 7.7% |
| Iranians | 100.0 /100 | #3 | Exceptional 7.6% |
| Filipinos | 100.0 /100 | #4 | Exceptional 7.6% |
| Immigrants | Iran | 100.0 /100 | #5 | Exceptional 7.3% |
| Okinawans | 100.0 /100 | #6 | Exceptional 7.3% |
| Eastern Europeans | 100.0 /100 | #7 | Exceptional 7.1% |
| Immigrants | Switzerland | 100.0 /100 | #8 | Exceptional 7.1% |
| Immigrants | Taiwan | 100.0 /100 | #9 | Exceptional 7.1% |
| Immigrants | Belgium | 100.0 /100 | #10 | Exceptional 7.0% |
| Cypriots | 100.0 /100 | #11 | Exceptional 6.9% |
| Israelis | 100.0 /100 | #12 | Exceptional 6.9% |
| Immigrants | Australia | 100.0 /100 | #13 | Exceptional 6.9% |
| Immigrants | France | 100.0 /100 | #14 | Exceptional 6.8% |
| Immigrants | China | 100.0 /100 | #15 | Exceptional 6.7% |
Demographics Similar to Immigrants from Czechoslovakia by Professional Degree
In terms of professional degree, the demographic groups most similar to Immigrants from Czechoslovakia are Immigrants from Greece (5.8%, a difference of 0.060%), Immigrants from Serbia (5.8%, a difference of 0.13%), Immigrants from Latvia (5.8%, a difference of 0.32%), Immigrants from Netherlands (5.8%, a difference of 0.36%), and Paraguayan (5.9%, a difference of 0.72%).
| Demographics | Rating | Rank | Professional Degree |
| Immigrants | Saudi Arabia | 100.0 /100 | #43 | Exceptional 5.9% |
| Argentineans | 100.0 /100 | #44 | Exceptional 5.9% |
| Immigrants | South Central Asia | 100.0 /100 | #45 | Exceptional 5.9% |
| Immigrants | Argentina | 100.0 /100 | #46 | Exceptional 5.9% |
| Australians | 100.0 /100 | #47 | Exceptional 5.9% |
| Paraguayans | 100.0 /100 | #48 | Exceptional 5.9% |
| Immigrants | Latvia | 100.0 /100 | #49 | Exceptional 5.8% |
| Immigrants | Czechoslovakia | 100.0 /100 | #50 | Exceptional 5.8% |
| Immigrants | Greece | 100.0 /100 | #51 | Exceptional 5.8% |
| Immigrants | Serbia | 100.0 /100 | #52 | Exceptional 5.8% |
| Immigrants | Netherlands | 100.0 /100 | #53 | Exceptional 5.8% |
| Immigrants | Kuwait | 100.0 /100 | #54 | Exceptional 5.7% |
| Immigrants | Western Europe | 100.0 /100 | #55 | Exceptional 5.7% |
| Immigrants | Malaysia | 100.0 /100 | #56 | Exceptional 5.7% |
| South Africans | 100.0 /100 | #57 | Exceptional 5.7% |