Finnish vs Immigrants from Uruguay Professional Degree
COMPARE
Finnish
Immigrants from Uruguay
Professional Degree
Professional Degree Comparison
Finns
Immigrants from Uruguay
4.2%
PROFESSIONAL DEGREE
18.7/ 100
METRIC RATING
201st/ 347
METRIC RANK
4.6%
PROFESSIONAL DEGREE
72.5/ 100
METRIC RATING
153rd/ 347
METRIC RANK
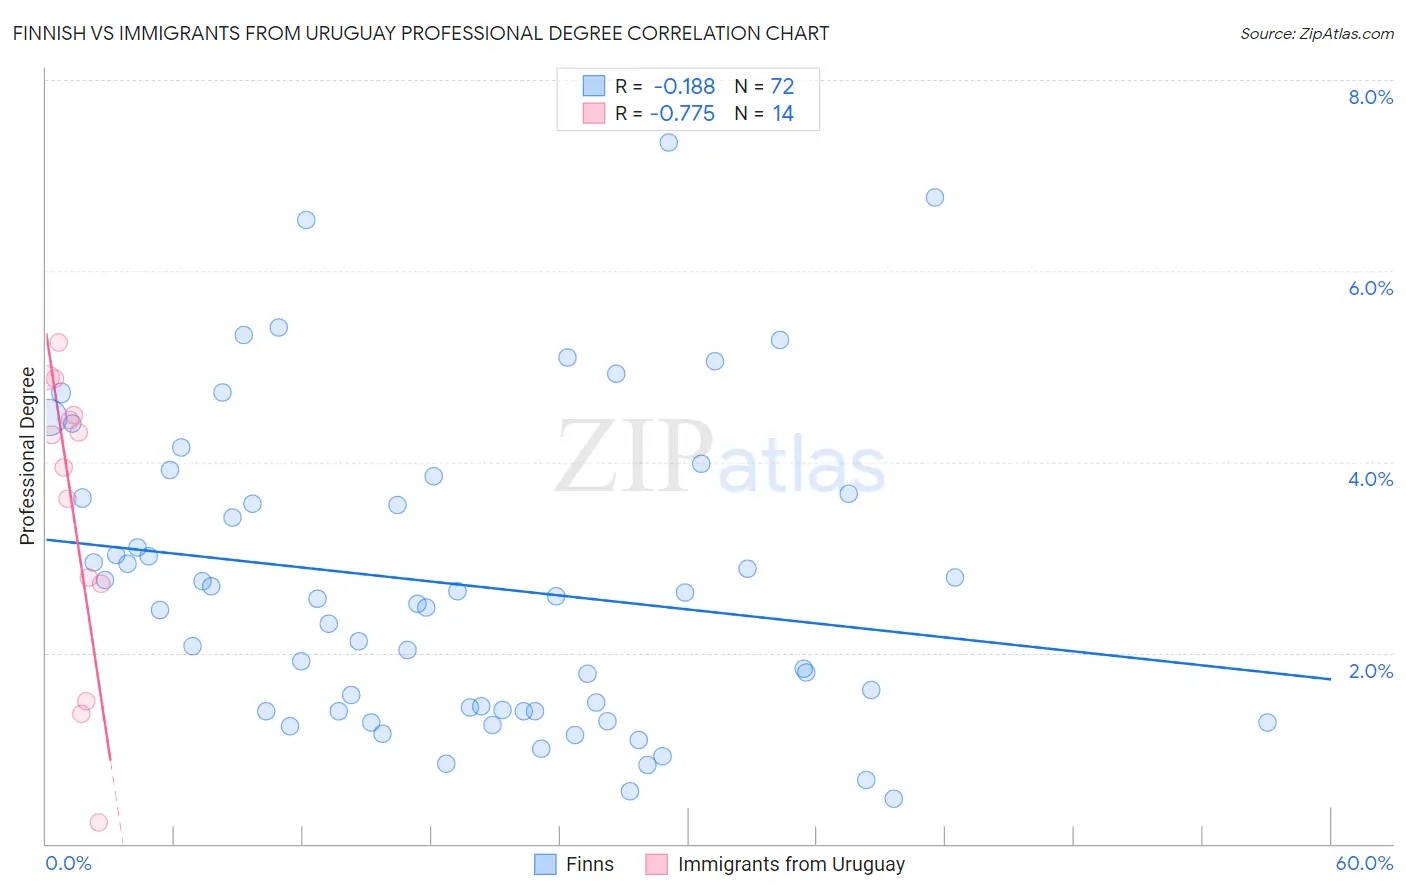
Finnish vs Immigrants from Uruguay Professional Degree Correlation Chart
The statistical analysis conducted on geographies consisting of 403,408,940 people shows a poor negative correlation between the proportion of Finns and percentage of population with at least professional degree education in the United States with a correlation coefficient (R) of -0.188 and weighted average of 4.2%. Similarly, the statistical analysis conducted on geographies consisting of 133,217,202 people shows a strong negative correlation between the proportion of Immigrants from Uruguay and percentage of population with at least professional degree education in the United States with a correlation coefficient (R) of -0.775 and weighted average of 4.6%, a difference of 9.3%.
Professional Degree Correlation Summary
| Measurement | Finnish | Immigrants from Uruguay |
| Minimum | 0.47% | 0.22% |
| Maximum | 7.3% | 5.3% |
| Range | 6.9% | 5.0% |
| Mean | 2.7% | 3.5% |
| Median | 2.5% | 4.1% |
| Interquartile 25% (IQ1) | 1.4% | 2.7% |
| Interquartile 75% (IQ3) | 3.6% | 4.5% |
| Interquartile Range (IQR) | 2.3% | 1.8% |
| Standard Deviation (Sample) | 1.6% | 1.5% |
| Standard Deviation (Population) | 1.6% | 1.5% |
Similar Demographics by Professional Degree
Demographics Similar to Finns by Professional Degree
In terms of professional degree, the demographic groups most similar to Finns are Immigrants from North Macedonia (4.2%, a difference of 0.36%), Immigrants from Iraq (4.2%, a difference of 0.43%), Norwegian (4.2%, a difference of 0.44%), Panamanian (4.1%, a difference of 0.76%), and Barbadian (4.1%, a difference of 0.79%).
| Demographics | Rating | Rank | Professional Degree |
| Scandinavians | 25.8 /100 | #194 | Fair 4.2% |
| Nigerians | 24.6 /100 | #195 | Fair 4.2% |
| Spanish | 23.0 /100 | #196 | Fair 4.2% |
| Czechoslovakians | 22.4 /100 | #197 | Fair 4.2% |
| Immigrants | Middle Africa | 22.1 /100 | #198 | Fair 4.2% |
| Norwegians | 20.5 /100 | #199 | Fair 4.2% |
| Immigrants | North Macedonia | 20.2 /100 | #200 | Fair 4.2% |
| Finns | 18.7 /100 | #201 | Poor 4.2% |
| Immigrants | Iraq | 17.1 /100 | #202 | Poor 4.2% |
| Panamanians | 15.9 /100 | #203 | Poor 4.1% |
| Barbadians | 15.8 /100 | #204 | Poor 4.1% |
| Somalis | 14.8 /100 | #205 | Poor 4.1% |
| Yugoslavians | 13.4 /100 | #206 | Poor 4.1% |
| Sub-Saharan Africans | 12.8 /100 | #207 | Poor 4.1% |
| Immigrants | Somalia | 12.5 /100 | #208 | Poor 4.1% |
Demographics Similar to Immigrants from Uruguay by Professional Degree
In terms of professional degree, the demographic groups most similar to Immigrants from Uruguay are Immigrants from Africa (4.6%, a difference of 0.0%), Polish (4.6%, a difference of 0.020%), Scottish (4.6%, a difference of 0.12%), Immigrants from Oceania (4.6%, a difference of 0.16%), and Slavic (4.5%, a difference of 0.30%).
| Demographics | Rating | Rank | Professional Degree |
| Luxembourgers | 78.7 /100 | #146 | Good 4.6% |
| Colombians | 77.7 /100 | #147 | Good 4.6% |
| Slovenes | 76.1 /100 | #148 | Good 4.6% |
| Senegalese | 75.3 /100 | #149 | Good 4.6% |
| Immigrants | Oceania | 73.4 /100 | #150 | Good 4.6% |
| Poles | 72.6 /100 | #151 | Good 4.6% |
| Immigrants | Africa | 72.5 /100 | #152 | Good 4.6% |
| Immigrants | Uruguay | 72.5 /100 | #153 | Good 4.6% |
| Scottish | 71.8 /100 | #154 | Good 4.6% |
| Slavs | 70.8 /100 | #155 | Good 4.5% |
| Swedes | 69.9 /100 | #156 | Good 4.5% |
| Iraqis | 69.8 /100 | #157 | Good 4.5% |
| Immigrants | Armenia | 68.8 /100 | #158 | Good 4.5% |
| Vietnamese | 68.4 /100 | #159 | Good 4.5% |
| Immigrants | Senegal | 68.0 /100 | #160 | Good 4.5% |