Filipino vs Paraguayan GED/Equivalency
COMPARE
Filipino
Paraguayan
GED/Equivalency
GED/Equivalency Comparison
Filipinos
Paraguayans
89.5%
GED/EQUIVALENCY
100.0/ 100
METRIC RATING
2nd/ 347
METRIC RANK
86.5%
GED/EQUIVALENCY
84.1/ 100
METRIC RATING
140th/ 347
METRIC RANK
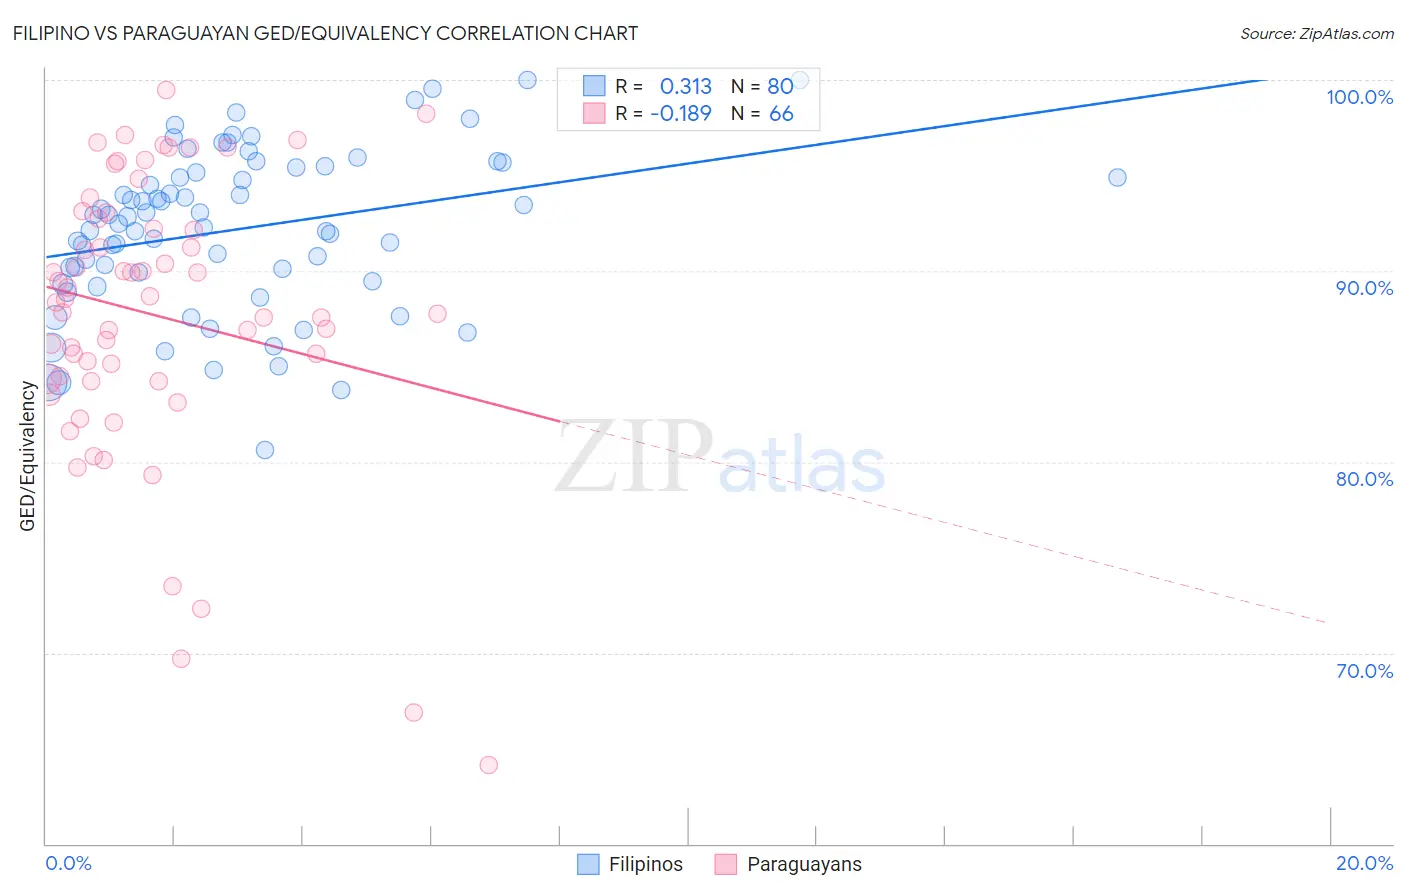
Filipino vs Paraguayan GED/Equivalency Correlation Chart
The statistical analysis conducted on geographies consisting of 254,349,672 people shows a mild positive correlation between the proportion of Filipinos and percentage of population with at least ged/equivalency education in the United States with a correlation coefficient (R) of 0.313 and weighted average of 89.5%. Similarly, the statistical analysis conducted on geographies consisting of 95,114,201 people shows a poor negative correlation between the proportion of Paraguayans and percentage of population with at least ged/equivalency education in the United States with a correlation coefficient (R) of -0.189 and weighted average of 86.5%, a difference of 3.5%.
GED/Equivalency Correlation Summary
| Measurement | Filipino | Paraguayan |
| Minimum | 80.6% | 64.2% |
| Maximum | 100.0% | 99.5% |
| Range | 19.4% | 35.3% |
| Mean | 92.2% | 87.7% |
| Median | 92.7% | 88.5% |
| Interquartile 25% (IQ1) | 89.7% | 84.4% |
| Interquartile 75% (IQ3) | 95.3% | 92.7% |
| Interquartile Range (IQR) | 5.6% | 8.3% |
| Standard Deviation (Sample) | 4.2% | 7.3% |
| Standard Deviation (Population) | 4.2% | 7.3% |
Similar Demographics by GED/Equivalency
Demographics Similar to Filipinos by GED/Equivalency
In terms of ged/equivalency, the demographic groups most similar to Filipinos are Immigrants from Singapore (89.3%, a difference of 0.21%), Immigrants from India (89.7%, a difference of 0.26%), Iranian (89.2%, a difference of 0.30%), Latvian (89.2%, a difference of 0.40%), and Thai (89.1%, a difference of 0.42%).
| Demographics | Rating | Rank | GED/Equivalency |
| Immigrants | India | 100.0 /100 | #1 | Exceptional 89.7% |
| Filipinos | 100.0 /100 | #2 | Exceptional 89.5% |
| Immigrants | Singapore | 100.0 /100 | #3 | Exceptional 89.3% |
| Iranians | 100.0 /100 | #4 | Exceptional 89.2% |
| Latvians | 100.0 /100 | #5 | Exceptional 89.2% |
| Thais | 100.0 /100 | #6 | Exceptional 89.1% |
| Eastern Europeans | 99.9 /100 | #7 | Exceptional 89.1% |
| Carpatho Rusyns | 99.9 /100 | #8 | Exceptional 89.1% |
| Chinese | 99.9 /100 | #9 | Exceptional 89.0% |
| Norwegians | 99.9 /100 | #10 | Exceptional 89.0% |
| Bulgarians | 99.9 /100 | #11 | Exceptional 89.0% |
| Lithuanians | 99.9 /100 | #12 | Exceptional 88.9% |
| Immigrants | Iran | 99.9 /100 | #13 | Exceptional 88.9% |
| Cypriots | 99.9 /100 | #14 | Exceptional 88.9% |
| Okinawans | 99.9 /100 | #15 | Exceptional 88.9% |
Demographics Similar to Paraguayans by GED/Equivalency
In terms of ged/equivalency, the demographic groups most similar to Paraguayans are Immigrants from Malaysia (86.5%, a difference of 0.030%), Laotian (86.5%, a difference of 0.030%), Immigrants from Indonesia (86.4%, a difference of 0.060%), Immigrants from Pakistan (86.4%, a difference of 0.060%), and Bolivian (86.4%, a difference of 0.070%).
| Demographics | Rating | Rank | GED/Equivalency |
| Tsimshian | 88.3 /100 | #133 | Excellent 86.6% |
| Albanians | 87.7 /100 | #134 | Excellent 86.6% |
| Immigrants | Asia | 87.4 /100 | #135 | Excellent 86.6% |
| Chileans | 86.9 /100 | #136 | Excellent 86.6% |
| Arabs | 86.7 /100 | #137 | Excellent 86.6% |
| Immigrants | Argentina | 86.5 /100 | #138 | Excellent 86.6% |
| Immigrants | Malaysia | 85.0 /100 | #139 | Excellent 86.5% |
| Paraguayans | 84.1 /100 | #140 | Excellent 86.5% |
| Laotians | 83.2 /100 | #141 | Excellent 86.5% |
| Immigrants | Indonesia | 82.4 /100 | #142 | Excellent 86.4% |
| Immigrants | Pakistan | 82.4 /100 | #143 | Excellent 86.4% |
| Bolivians | 82.1 /100 | #144 | Excellent 86.4% |
| Pakistanis | 80.4 /100 | #145 | Excellent 86.4% |
| Basques | 79.5 /100 | #146 | Good 86.4% |
| Immigrants | Northern Africa | 79.3 /100 | #147 | Good 86.3% |