Filipino vs Peruvian High School Diploma
COMPARE
Filipino
Peruvian
High School Diploma
High School Diploma Comparison
Filipinos
Peruvians
91.6%
HIGH SCHOOL DIPLOMA
99.9/ 100
METRIC RATING
21st/ 347
METRIC RANK
87.8%
HIGH SCHOOL DIPLOMA
1.9/ 100
METRIC RATING
245th/ 347
METRIC RANK
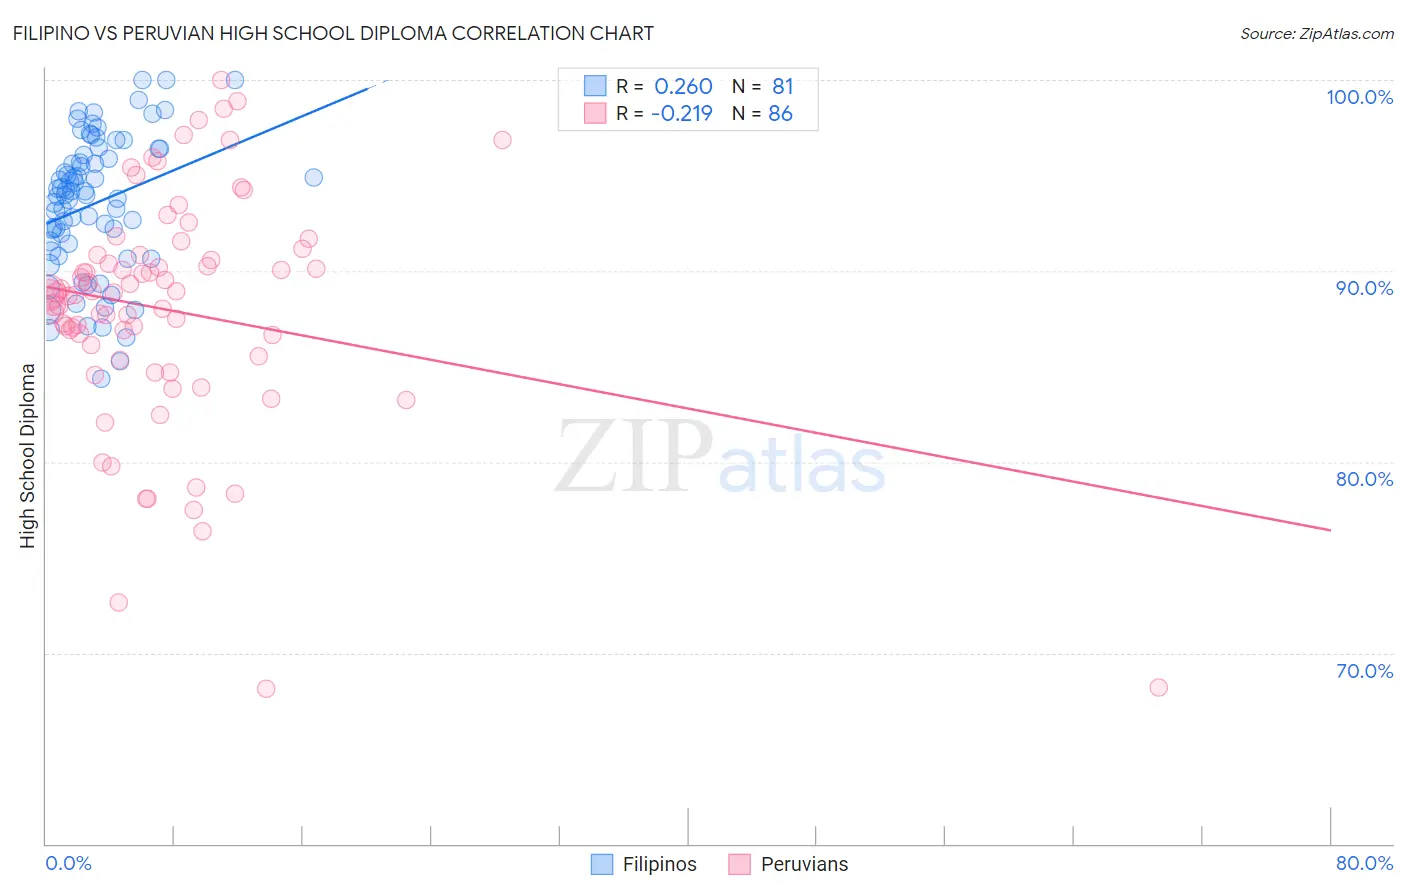
Filipino vs Peruvian High School Diploma Correlation Chart
The statistical analysis conducted on geographies consisting of 254,351,912 people shows a weak positive correlation between the proportion of Filipinos and percentage of population with at least high school diploma education in the United States with a correlation coefficient (R) of 0.260 and weighted average of 91.6%. Similarly, the statistical analysis conducted on geographies consisting of 363,251,075 people shows a weak negative correlation between the proportion of Peruvians and percentage of population with at least high school diploma education in the United States with a correlation coefficient (R) of -0.219 and weighted average of 87.8%, a difference of 4.3%.
High School Diploma Correlation Summary
| Measurement | Filipino | Peruvian |
| Minimum | 84.4% | 68.1% |
| Maximum | 100.0% | 100.0% |
| Range | 15.6% | 31.9% |
| Mean | 93.5% | 87.9% |
| Median | 94.0% | 88.8% |
| Interquartile 25% (IQ1) | 91.2% | 85.5% |
| Interquartile 75% (IQ3) | 96.2% | 90.8% |
| Interquartile Range (IQR) | 5.0% | 5.3% |
| Standard Deviation (Sample) | 3.6% | 6.1% |
| Standard Deviation (Population) | 3.6% | 6.1% |
Similar Demographics by High School Diploma
Demographics Similar to Filipinos by High School Diploma
In terms of high school diploma, the demographic groups most similar to Filipinos are Czech (91.6%, a difference of 0.010%), Estonian (91.6%, a difference of 0.010%), Maltese (91.6%, a difference of 0.040%), Scandinavian (91.5%, a difference of 0.040%), and Italian (91.5%, a difference of 0.040%).
| Demographics | Rating | Rank | High School Diploma |
| Bulgarians | 100.0 /100 | #14 | Exceptional 91.8% |
| Luxembourgers | 100.0 /100 | #15 | Exceptional 91.7% |
| Finns | 100.0 /100 | #16 | Exceptional 91.7% |
| Immigrants | Singapore | 99.9 /100 | #17 | Exceptional 91.7% |
| Germans | 99.9 /100 | #18 | Exceptional 91.7% |
| Maltese | 99.9 /100 | #19 | Exceptional 91.6% |
| Czechs | 99.9 /100 | #20 | Exceptional 91.6% |
| Filipinos | 99.9 /100 | #21 | Exceptional 91.6% |
| Estonians | 99.9 /100 | #22 | Exceptional 91.6% |
| Scandinavians | 99.9 /100 | #23 | Exceptional 91.5% |
| Italians | 99.9 /100 | #24 | Exceptional 91.5% |
| Thais | 99.9 /100 | #25 | Exceptional 91.5% |
| Russians | 99.9 /100 | #26 | Exceptional 91.5% |
| Cypriots | 99.9 /100 | #27 | Exceptional 91.5% |
| Tlingit-Haida | 99.9 /100 | #28 | Exceptional 91.4% |
Demographics Similar to Peruvians by High School Diploma
In terms of high school diploma, the demographic groups most similar to Peruvians are Immigrants from Philippines (87.8%, a difference of 0.010%), Choctaw (87.8%, a difference of 0.010%), Immigrants from Eritrea (87.8%, a difference of 0.030%), Immigrants from Uzbekistan (87.8%, a difference of 0.040%), and Cheyenne (87.8%, a difference of 0.040%).
| Demographics | Rating | Rank | High School Diploma |
| Sioux | 2.7 /100 | #238 | Tragic 87.9% |
| South Americans | 2.7 /100 | #239 | Tragic 87.9% |
| Comanche | 2.2 /100 | #240 | Tragic 87.9% |
| Immigrants | Uzbekistan | 2.1 /100 | #241 | Tragic 87.8% |
| Cheyenne | 2.1 /100 | #242 | Tragic 87.8% |
| Immigrants | Philippines | 1.9 /100 | #243 | Tragic 87.8% |
| Choctaw | 1.9 /100 | #244 | Tragic 87.8% |
| Peruvians | 1.9 /100 | #245 | Tragic 87.8% |
| Immigrants | Eritrea | 1.7 /100 | #246 | Tragic 87.8% |
| Immigrants | Costa Rica | 1.7 /100 | #247 | Tragic 87.8% |
| Spanish Americans | 1.5 /100 | #248 | Tragic 87.7% |
| Senegalese | 1.5 /100 | #249 | Tragic 87.7% |
| Immigrants | Nigeria | 1.5 /100 | #250 | Tragic 87.7% |
| Ghanaians | 1.4 /100 | #251 | Tragic 87.7% |
| Immigrants | South America | 1.2 /100 | #252 | Tragic 87.6% |