Fijian vs Spanish High School Diploma
COMPARE
Fijian
Spanish
High School Diploma
High School Diploma Comparison
Fijians
Spanish
86.0%
HIGH SCHOOL DIPLOMA
0.0/ 100
METRIC RATING
290th/ 347
METRIC RANK
89.2%
HIGH SCHOOL DIPLOMA
52.9/ 100
METRIC RATING
171st/ 347
METRIC RANK
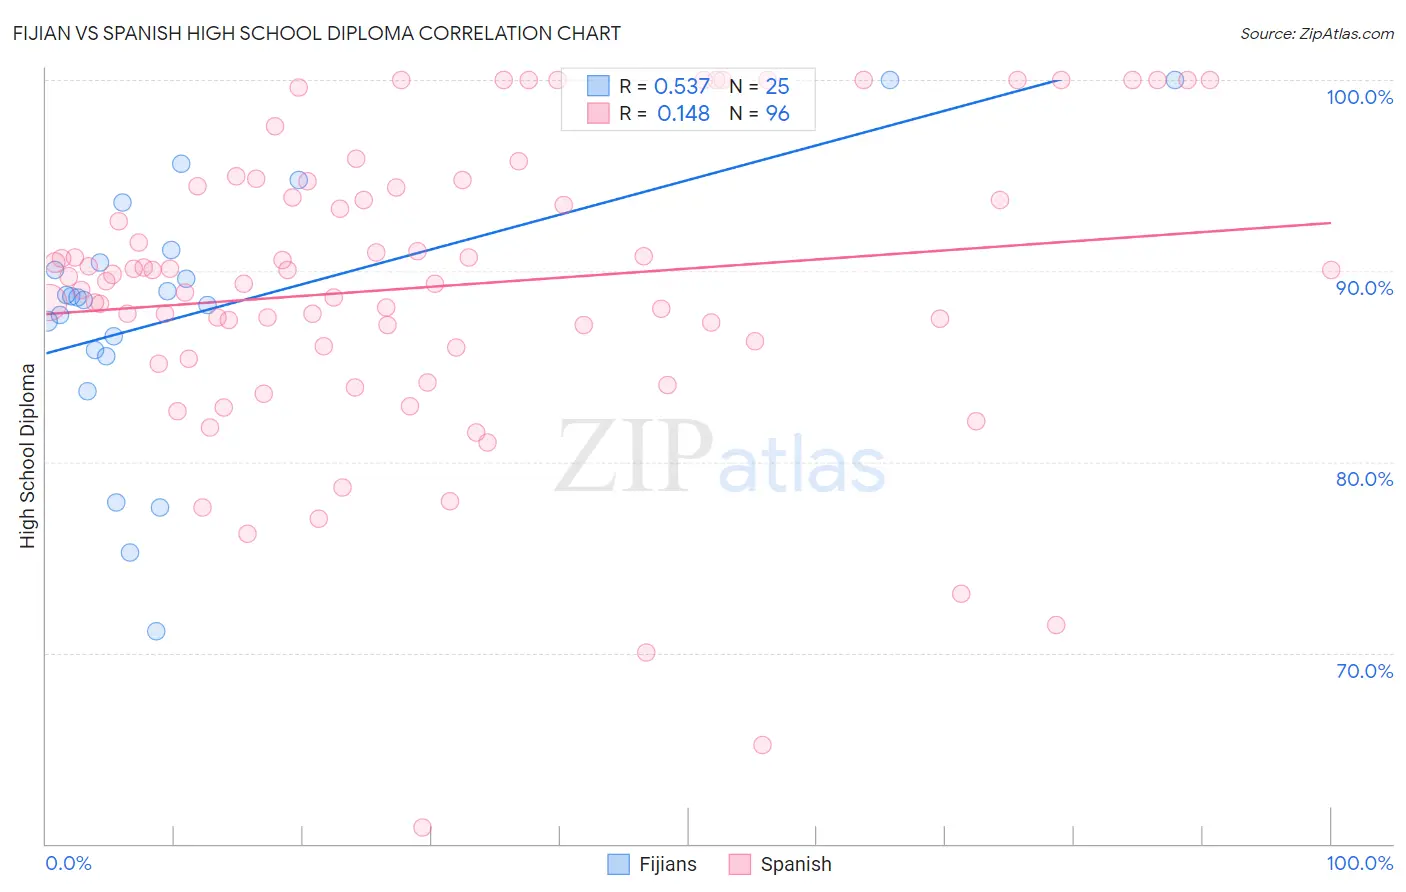
Fijian vs Spanish High School Diploma Correlation Chart
The statistical analysis conducted on geographies consisting of 55,948,842 people shows a substantial positive correlation between the proportion of Fijians and percentage of population with at least high school diploma education in the United States with a correlation coefficient (R) of 0.537 and weighted average of 86.0%. Similarly, the statistical analysis conducted on geographies consisting of 422,189,152 people shows a poor positive correlation between the proportion of Spanish and percentage of population with at least high school diploma education in the United States with a correlation coefficient (R) of 0.148 and weighted average of 89.2%, a difference of 3.7%.
High School Diploma Correlation Summary
| Measurement | Fijian | Spanish |
| Minimum | 71.1% | 60.9% |
| Maximum | 100.0% | 100.0% |
| Range | 28.9% | 39.1% |
| Mean | 87.8% | 89.2% |
| Median | 88.6% | 89.8% |
| Interquartile 25% (IQ1) | 85.7% | 86.0% |
| Interquartile 75% (IQ3) | 90.8% | 94.4% |
| Interquartile Range (IQR) | 5.1% | 8.4% |
| Standard Deviation (Sample) | 6.9% | 7.9% |
| Standard Deviation (Population) | 6.7% | 7.8% |
Similar Demographics by High School Diploma
Demographics Similar to Fijians by High School Diploma
In terms of high school diploma, the demographic groups most similar to Fijians are Yup'ik (86.1%, a difference of 0.070%), Haitian (85.9%, a difference of 0.13%), Japanese (85.9%, a difference of 0.14%), British West Indian (85.9%, a difference of 0.16%), and Ute (86.2%, a difference of 0.18%).
| Demographics | Rating | Rank | High School Diploma |
| Immigrants | Barbados | 0.0 /100 | #283 | Tragic 86.4% |
| Paiute | 0.0 /100 | #284 | Tragic 86.4% |
| Immigrants | West Indies | 0.0 /100 | #285 | Tragic 86.2% |
| Immigrants | St. Vincent and the Grenadines | 0.0 /100 | #286 | Tragic 86.2% |
| Ute | 0.0 /100 | #287 | Tragic 86.2% |
| Immigrants | Vietnam | 0.0 /100 | #288 | Tragic 86.2% |
| Yup'ik | 0.0 /100 | #289 | Tragic 86.1% |
| Fijians | 0.0 /100 | #290 | Tragic 86.0% |
| Haitians | 0.0 /100 | #291 | Tragic 85.9% |
| Japanese | 0.0 /100 | #292 | Tragic 85.9% |
| British West Indians | 0.0 /100 | #293 | Tragic 85.9% |
| Immigrants | Fiji | 0.0 /100 | #294 | Tragic 85.8% |
| Immigrants | Immigrants | 0.0 /100 | #295 | Tragic 85.8% |
| Immigrants | Cambodia | 0.0 /100 | #296 | Tragic 85.6% |
| Immigrants | Grenada | 0.0 /100 | #297 | Tragic 85.6% |
Demographics Similar to Spanish by High School Diploma
In terms of high school diploma, the demographic groups most similar to Spanish are Immigrants from Morocco (89.2%, a difference of 0.010%), Nonimmigrants (89.2%, a difference of 0.020%), Iroquois (89.2%, a difference of 0.030%), Delaware (89.2%, a difference of 0.040%), and Immigrants from Indonesia (89.1%, a difference of 0.040%).
| Demographics | Rating | Rank | High School Diploma |
| Immigrants | Nepal | 61.1 /100 | #164 | Good 89.3% |
| Immigrants | Asia | 59.8 /100 | #165 | Average 89.3% |
| Immigrants | Albania | 59.4 /100 | #166 | Average 89.3% |
| Immigrants | Hong Kong | 58.6 /100 | #167 | Average 89.3% |
| Delaware | 55.8 /100 | #168 | Average 89.2% |
| Iroquois | 55.1 /100 | #169 | Average 89.2% |
| Immigrants | Morocco | 53.3 /100 | #170 | Average 89.2% |
| Spanish | 52.9 /100 | #171 | Average 89.2% |
| Immigrants | Nonimmigrants | 51.8 /100 | #172 | Average 89.2% |
| Immigrants | Indonesia | 50.3 /100 | #173 | Average 89.1% |
| Hmong | 50.0 /100 | #174 | Average 89.1% |
| Immigrants | Western Asia | 49.0 /100 | #175 | Average 89.1% |
| Osage | 48.9 /100 | #176 | Average 89.1% |
| Sudanese | 48.5 /100 | #177 | Average 89.1% |
| Sierra Leoneans | 48.4 /100 | #178 | Average 89.1% |