Fijian vs Immigrants from Cuba Nursery School
COMPARE
Fijian
Immigrants from Cuba
Nursery School
Nursery School Comparison
Fijians
Immigrants from Cuba
97.6%
NURSERY SCHOOL
0.3/ 100
METRIC RATING
263rd/ 347
METRIC RANK
97.2%
NURSERY SCHOOL
0.0/ 100
METRIC RATING
297th/ 347
METRIC RANK
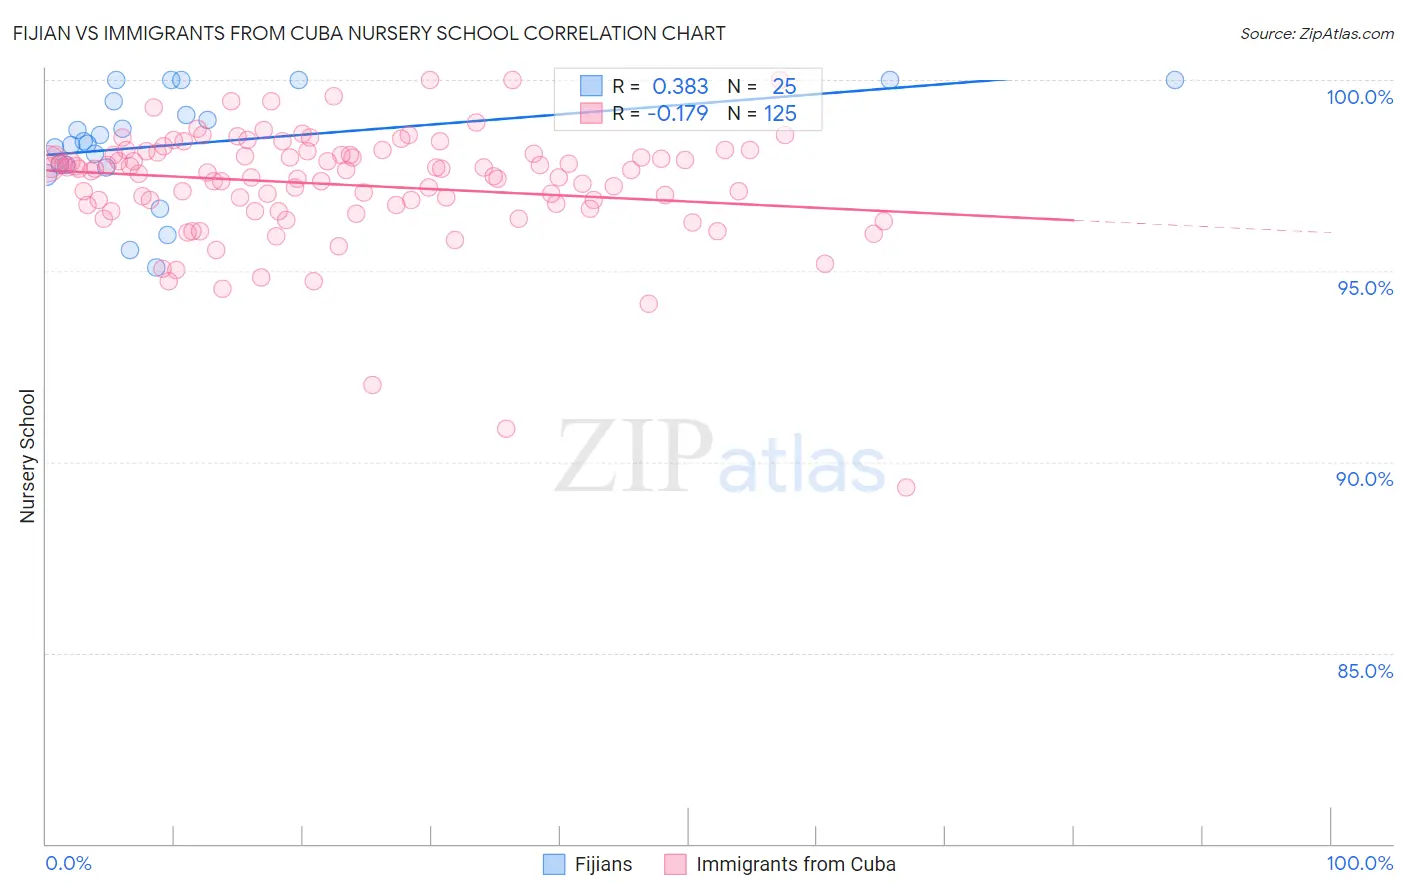
Fijian vs Immigrants from Cuba Nursery School Correlation Chart
The statistical analysis conducted on geographies consisting of 55,948,842 people shows a mild positive correlation between the proportion of Fijians and percentage of population with at least nursery school education in the United States with a correlation coefficient (R) of 0.383 and weighted average of 97.6%. Similarly, the statistical analysis conducted on geographies consisting of 326,028,159 people shows a poor negative correlation between the proportion of Immigrants from Cuba and percentage of population with at least nursery school education in the United States with a correlation coefficient (R) of -0.179 and weighted average of 97.2%, a difference of 0.38%.
Nursery School Correlation Summary
| Measurement | Fijian | Immigrants from Cuba |
| Minimum | 95.1% | 89.3% |
| Maximum | 100.0% | 100.0% |
| Range | 4.9% | 10.7% |
| Mean | 98.3% | 97.3% |
| Median | 98.4% | 97.6% |
| Interquartile 25% (IQ1) | 97.7% | 96.7% |
| Interquartile 75% (IQ3) | 99.7% | 98.1% |
| Interquartile Range (IQR) | 2.0% | 1.4% |
| Standard Deviation (Sample) | 1.4% | 1.5% |
| Standard Deviation (Population) | 1.4% | 1.5% |
Similar Demographics by Nursery School
Demographics Similar to Fijians by Nursery School
In terms of nursery school, the demographic groups most similar to Fijians are Immigrants from Ethiopia (97.6%, a difference of 0.0%), Taiwanese (97.6%, a difference of 0.0%), Assyrian/Chaldean/Syriac (97.6%, a difference of 0.0%), Immigrants from South America (97.6%, a difference of 0.010%), and Cuban (97.6%, a difference of 0.010%).
| Demographics | Rating | Rank | Nursery School |
| Yaqui | 0.6 /100 | #256 | Tragic 97.6% |
| Immigrants | Colombia | 0.6 /100 | #257 | Tragic 97.6% |
| Jamaicans | 0.6 /100 | #258 | Tragic 97.6% |
| Armenians | 0.4 /100 | #259 | Tragic 97.6% |
| Immigrants | South America | 0.4 /100 | #260 | Tragic 97.6% |
| Cubans | 0.4 /100 | #261 | Tragic 97.6% |
| Immigrants | Ethiopia | 0.4 /100 | #262 | Tragic 97.6% |
| Fijians | 0.3 /100 | #263 | Tragic 97.6% |
| Taiwanese | 0.3 /100 | #264 | Tragic 97.6% |
| Assyrians/Chaldeans/Syriacs | 0.3 /100 | #265 | Tragic 97.6% |
| Immigrants | Sierra Leone | 0.3 /100 | #266 | Tragic 97.6% |
| Immigrants | Nigeria | 0.3 /100 | #267 | Tragic 97.5% |
| West Indians | 0.3 /100 | #268 | Tragic 97.5% |
| Immigrants | Liberia | 0.3 /100 | #269 | Tragic 97.5% |
| Immigrants | Jamaica | 0.2 /100 | #270 | Tragic 97.5% |
Demographics Similar to Immigrants from Cuba by Nursery School
In terms of nursery school, the demographic groups most similar to Immigrants from Cuba are Central American Indian (97.2%, a difference of 0.010%), Immigrants from Dominica (97.2%, a difference of 0.010%), Haitian (97.2%, a difference of 0.030%), Immigrants from Eritrea (97.2%, a difference of 0.040%), and Immigrants (97.2%, a difference of 0.050%).
| Demographics | Rating | Rank | Nursery School |
| Immigrants | Afghanistan | 0.0 /100 | #290 | Tragic 97.3% |
| British West Indians | 0.0 /100 | #291 | Tragic 97.3% |
| Houma | 0.0 /100 | #292 | Tragic 97.3% |
| Malaysians | 0.0 /100 | #293 | Tragic 97.3% |
| Immigrants | Grenada | 0.0 /100 | #294 | Tragic 97.3% |
| Immigrants | Immigrants | 0.0 /100 | #295 | Tragic 97.2% |
| Immigrants | Eritrea | 0.0 /100 | #296 | Tragic 97.2% |
| Immigrants | Cuba | 0.0 /100 | #297 | Tragic 97.2% |
| Central American Indians | 0.0 /100 | #298 | Tragic 97.2% |
| Immigrants | Dominica | 0.0 /100 | #299 | Tragic 97.2% |
| Haitians | 0.0 /100 | #300 | Tragic 97.2% |
| Immigrants | South Eastern Asia | 0.0 /100 | #301 | Tragic 97.1% |
| Immigrants | Caribbean | 0.0 /100 | #302 | Tragic 97.1% |
| Nicaraguans | 0.0 /100 | #303 | Tragic 97.1% |
| Ecuadorians | 0.0 /100 | #304 | Tragic 97.1% |