Welsh vs Immigrants from Cameroon Master's Degree
COMPARE
Welsh
Immigrants from Cameroon
Master's Degree
Master's Degree Comparison
Welsh
Immigrants from Cameroon
14.6%
MASTER'S DEGREE
34.2/ 100
METRIC RATING
191st/ 347
METRIC RANK
15.4%
MASTER'S DEGREE
71.7/ 100
METRIC RATING
157th/ 347
METRIC RANK
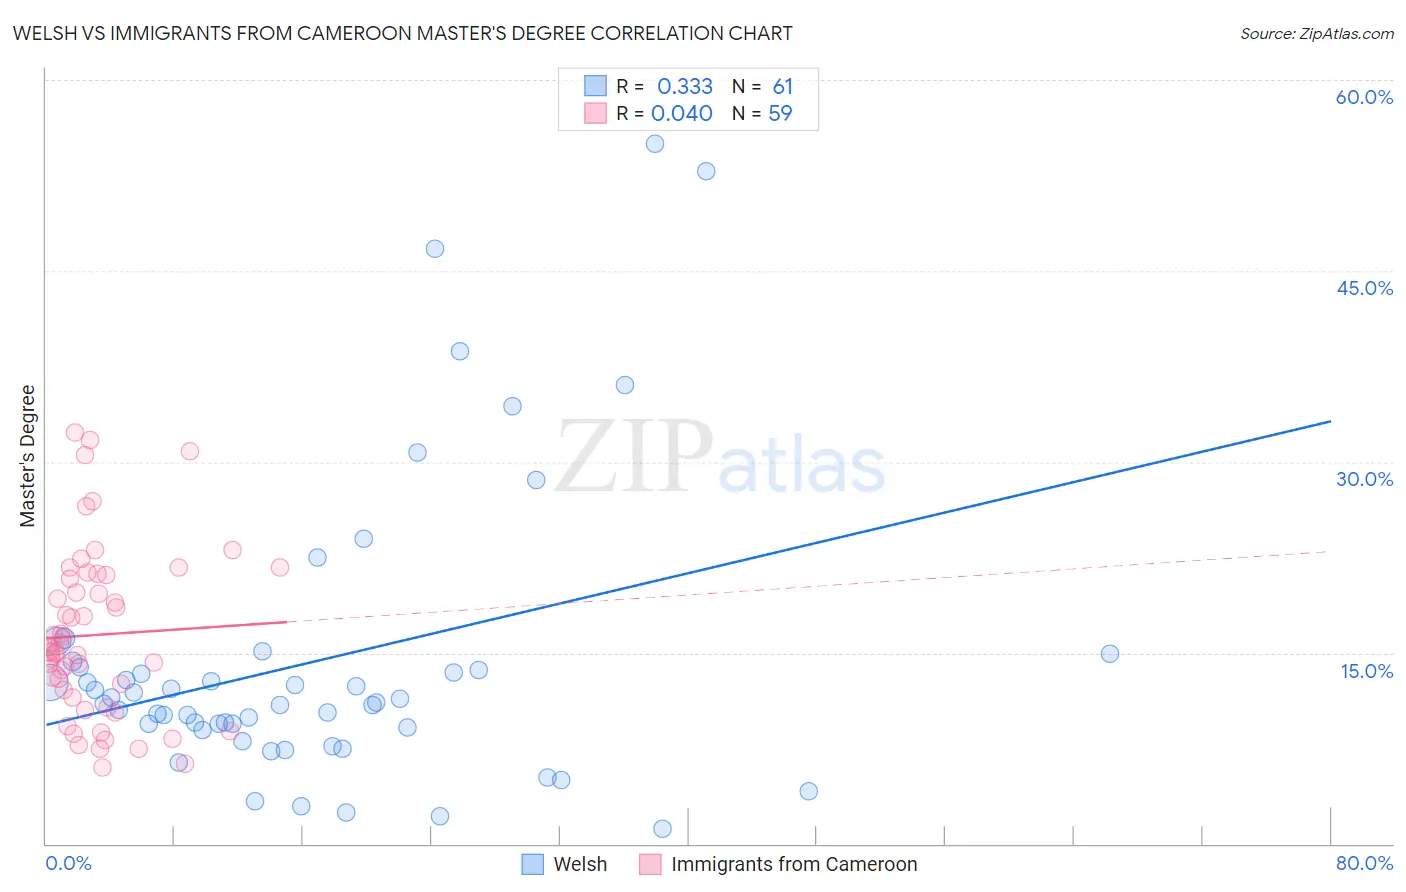
Welsh vs Immigrants from Cameroon Master's Degree Correlation Chart
The statistical analysis conducted on geographies consisting of 528,158,256 people shows a mild positive correlation between the proportion of Welsh and percentage of population with at least master's degree education in the United States with a correlation coefficient (R) of 0.333 and weighted average of 14.6%. Similarly, the statistical analysis conducted on geographies consisting of 130,754,355 people shows no correlation between the proportion of Immigrants from Cameroon and percentage of population with at least master's degree education in the United States with a correlation coefficient (R) of 0.040 and weighted average of 15.4%, a difference of 5.2%.
Master's Degree Correlation Summary
| Measurement | Welsh | Immigrants from Cameroon |
| Minimum | 1.2% | 6.0% |
| Maximum | 55.0% | 32.3% |
| Range | 53.8% | 26.3% |
| Mean | 14.4% | 16.4% |
| Median | 11.1% | 15.3% |
| Interquartile 25% (IQ1) | 9.0% | 11.5% |
| Interquartile 75% (IQ3) | 14.1% | 21.1% |
| Interquartile Range (IQR) | 5.1% | 9.5% |
| Standard Deviation (Sample) | 11.5% | 6.6% |
| Standard Deviation (Population) | 11.4% | 6.5% |
Similar Demographics by Master's Degree
Demographics Similar to Welsh by Master's Degree
In terms of master's degree, the demographic groups most similar to Welsh are Immigrants from Middle Africa (14.6%, a difference of 0.090%), Immigrants from Nigeria (14.6%, a difference of 0.22%), Spaniard (14.6%, a difference of 0.23%), Immigrants (14.6%, a difference of 0.25%), and Chinese (14.6%, a difference of 0.26%).
| Demographics | Rating | Rank | Master's Degree |
| Immigrants | Zaire | 39.5 /100 | #184 | Fair 14.7% |
| Barbadians | 38.3 /100 | #185 | Fair 14.7% |
| Immigrants | Oceania | 37.1 /100 | #186 | Fair 14.7% |
| Basques | 36.5 /100 | #187 | Fair 14.7% |
| Immigrants | Costa Rica | 36.2 /100 | #188 | Fair 14.7% |
| Immigrants | Immigrants | 36.0 /100 | #189 | Fair 14.6% |
| Spaniards | 35.8 /100 | #190 | Fair 14.6% |
| Welsh | 34.2 /100 | #191 | Fair 14.6% |
| Immigrants | Middle Africa | 33.6 /100 | #192 | Fair 14.6% |
| Immigrants | Nigeria | 32.7 /100 | #193 | Fair 14.6% |
| Chinese | 32.5 /100 | #194 | Fair 14.6% |
| Danes | 31.3 /100 | #195 | Fair 14.5% |
| Czechoslovakians | 29.9 /100 | #196 | Fair 14.5% |
| Belgians | 28.0 /100 | #197 | Fair 14.5% |
| West Indians | 27.4 /100 | #198 | Fair 14.5% |
Demographics Similar to Immigrants from Cameroon by Master's Degree
In terms of master's degree, the demographic groups most similar to Immigrants from Cameroon are Immigrants from Poland (15.4%, a difference of 0.040%), Luxembourger (15.3%, a difference of 0.11%), Kenyan (15.3%, a difference of 0.22%), Bermudan (15.4%, a difference of 0.35%), and Sudanese (15.3%, a difference of 0.45%).
| Demographics | Rating | Rank | Master's Degree |
| Slovenes | 78.0 /100 | #150 | Good 15.5% |
| Iraqis | 77.3 /100 | #151 | Good 15.5% |
| Slavs | 77.0 /100 | #152 | Good 15.5% |
| Icelanders | 76.8 /100 | #153 | Good 15.5% |
| Immigrants | South America | 76.3 /100 | #154 | Good 15.5% |
| Immigrants | Bangladesh | 76.1 /100 | #155 | Good 15.5% |
| Bermudans | 73.9 /100 | #156 | Good 15.4% |
| Immigrants | Cameroon | 71.7 /100 | #157 | Good 15.4% |
| Immigrants | Poland | 71.5 /100 | #158 | Good 15.4% |
| Luxembourgers | 71.0 /100 | #159 | Good 15.3% |
| Kenyans | 70.3 /100 | #160 | Good 15.3% |
| Sudanese | 68.7 /100 | #161 | Good 15.3% |
| Peruvians | 68.7 /100 | #162 | Good 15.3% |
| Uruguayans | 67.1 /100 | #163 | Good 15.3% |
| Colombians | 66.9 /100 | #164 | Good 15.3% |