Immigrants from Scotland vs Immigrants from Cameroon Master's Degree
COMPARE
Immigrants from Scotland
Immigrants from Cameroon
Master's Degree
Master's Degree Comparison
Immigrants from Scotland
Immigrants from Cameroon
17.4%
MASTER'S DEGREE
99.4/ 100
METRIC RATING
84th/ 347
METRIC RANK
15.4%
MASTER'S DEGREE
71.7/ 100
METRIC RATING
157th/ 347
METRIC RANK
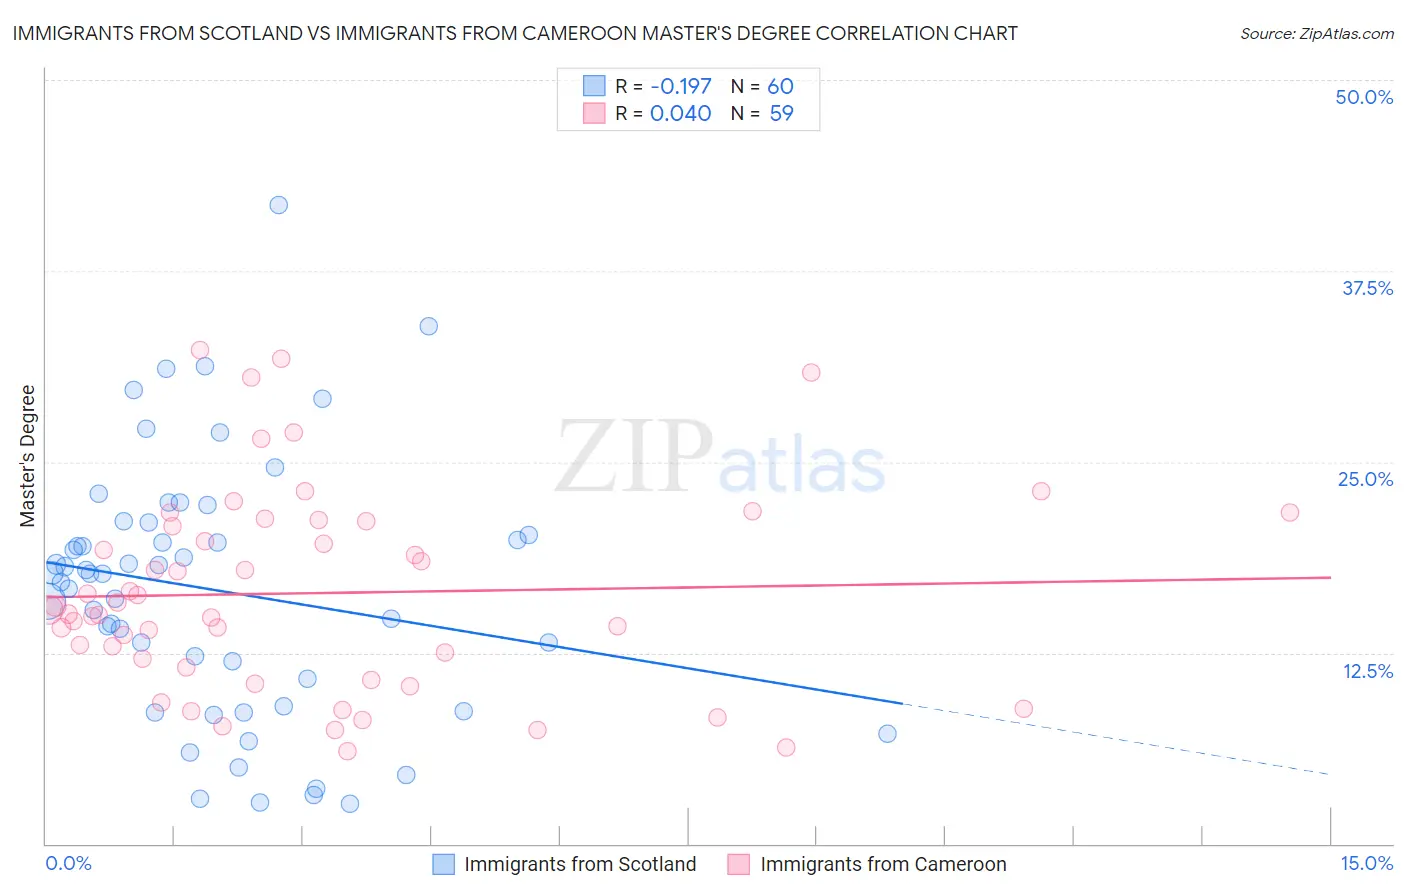
Immigrants from Scotland vs Immigrants from Cameroon Master's Degree Correlation Chart
The statistical analysis conducted on geographies consisting of 196,383,554 people shows a poor negative correlation between the proportion of Immigrants from Scotland and percentage of population with at least master's degree education in the United States with a correlation coefficient (R) of -0.197 and weighted average of 17.4%. Similarly, the statistical analysis conducted on geographies consisting of 130,754,355 people shows no correlation between the proportion of Immigrants from Cameroon and percentage of population with at least master's degree education in the United States with a correlation coefficient (R) of 0.040 and weighted average of 15.4%, a difference of 13.1%.
Master's Degree Correlation Summary
| Measurement | Immigrants from Scotland | Immigrants from Cameroon |
| Minimum | 2.6% | 6.0% |
| Maximum | 41.8% | 32.3% |
| Range | 39.2% | 26.3% |
| Mean | 16.6% | 16.4% |
| Median | 17.7% | 15.3% |
| Interquartile 25% (IQ1) | 9.9% | 11.5% |
| Interquartile 75% (IQ3) | 20.6% | 21.1% |
| Interquartile Range (IQR) | 10.7% | 9.5% |
| Standard Deviation (Sample) | 8.4% | 6.6% |
| Standard Deviation (Population) | 8.3% | 6.5% |
Similar Demographics by Master's Degree
Demographics Similar to Immigrants from Scotland by Master's Degree
In terms of master's degree, the demographic groups most similar to Immigrants from Scotland are Immigrants from Brazil (17.4%, a difference of 0.18%), Immigrants from Zimbabwe (17.4%, a difference of 0.33%), Greek (17.5%, a difference of 0.39%), Immigrants from Western Asia (17.5%, a difference of 0.44%), and Immigrants from Croatia (17.3%, a difference of 0.59%).
| Demographics | Rating | Rank | Master's Degree |
| Immigrants | Eastern Europe | 99.6 /100 | #77 | Exceptional 17.6% |
| Immigrants | Hungary | 99.6 /100 | #78 | Exceptional 17.5% |
| Immigrants | Lebanon | 99.6 /100 | #79 | Exceptional 17.5% |
| Carpatho Rusyns | 99.6 /100 | #80 | Exceptional 17.5% |
| Immigrants | Western Asia | 99.5 /100 | #81 | Exceptional 17.5% |
| Greeks | 99.5 /100 | #82 | Exceptional 17.5% |
| Immigrants | Zimbabwe | 99.5 /100 | #83 | Exceptional 17.4% |
| Immigrants | Scotland | 99.4 /100 | #84 | Exceptional 17.4% |
| Immigrants | Brazil | 99.4 /100 | #85 | Exceptional 17.4% |
| Immigrants | Croatia | 99.3 /100 | #86 | Exceptional 17.3% |
| Maltese | 99.3 /100 | #87 | Exceptional 17.3% |
| Immigrants | Canada | 99.2 /100 | #88 | Exceptional 17.2% |
| Bhutanese | 99.1 /100 | #89 | Exceptional 17.2% |
| Immigrants | Egypt | 99.1 /100 | #90 | Exceptional 17.2% |
| Romanians | 99.1 /100 | #91 | Exceptional 17.2% |
Demographics Similar to Immigrants from Cameroon by Master's Degree
In terms of master's degree, the demographic groups most similar to Immigrants from Cameroon are Immigrants from Poland (15.4%, a difference of 0.040%), Luxembourger (15.3%, a difference of 0.11%), Kenyan (15.3%, a difference of 0.22%), Bermudan (15.4%, a difference of 0.35%), and Sudanese (15.3%, a difference of 0.45%).
| Demographics | Rating | Rank | Master's Degree |
| Slovenes | 78.0 /100 | #150 | Good 15.5% |
| Iraqis | 77.3 /100 | #151 | Good 15.5% |
| Slavs | 77.0 /100 | #152 | Good 15.5% |
| Icelanders | 76.8 /100 | #153 | Good 15.5% |
| Immigrants | South America | 76.3 /100 | #154 | Good 15.5% |
| Immigrants | Bangladesh | 76.1 /100 | #155 | Good 15.5% |
| Bermudans | 73.9 /100 | #156 | Good 15.4% |
| Immigrants | Cameroon | 71.7 /100 | #157 | Good 15.4% |
| Immigrants | Poland | 71.5 /100 | #158 | Good 15.4% |
| Luxembourgers | 71.0 /100 | #159 | Good 15.3% |
| Kenyans | 70.3 /100 | #160 | Good 15.3% |
| Sudanese | 68.7 /100 | #161 | Good 15.3% |
| Peruvians | 68.7 /100 | #162 | Good 15.3% |
| Uruguayans | 67.1 /100 | #163 | Good 15.3% |
| Colombians | 66.9 /100 | #164 | Good 15.3% |