European vs Ethiopian Doctorate Degree
COMPARE
European
Ethiopian
Doctorate Degree
Doctorate Degree Comparison
Europeans
Ethiopians
2.1%
DOCTORATE DEGREE
97.5/ 100
METRIC RATING
107th/ 347
METRIC RANK
2.3%
DOCTORATE DEGREE
99.9/ 100
METRIC RATING
58th/ 347
METRIC RANK
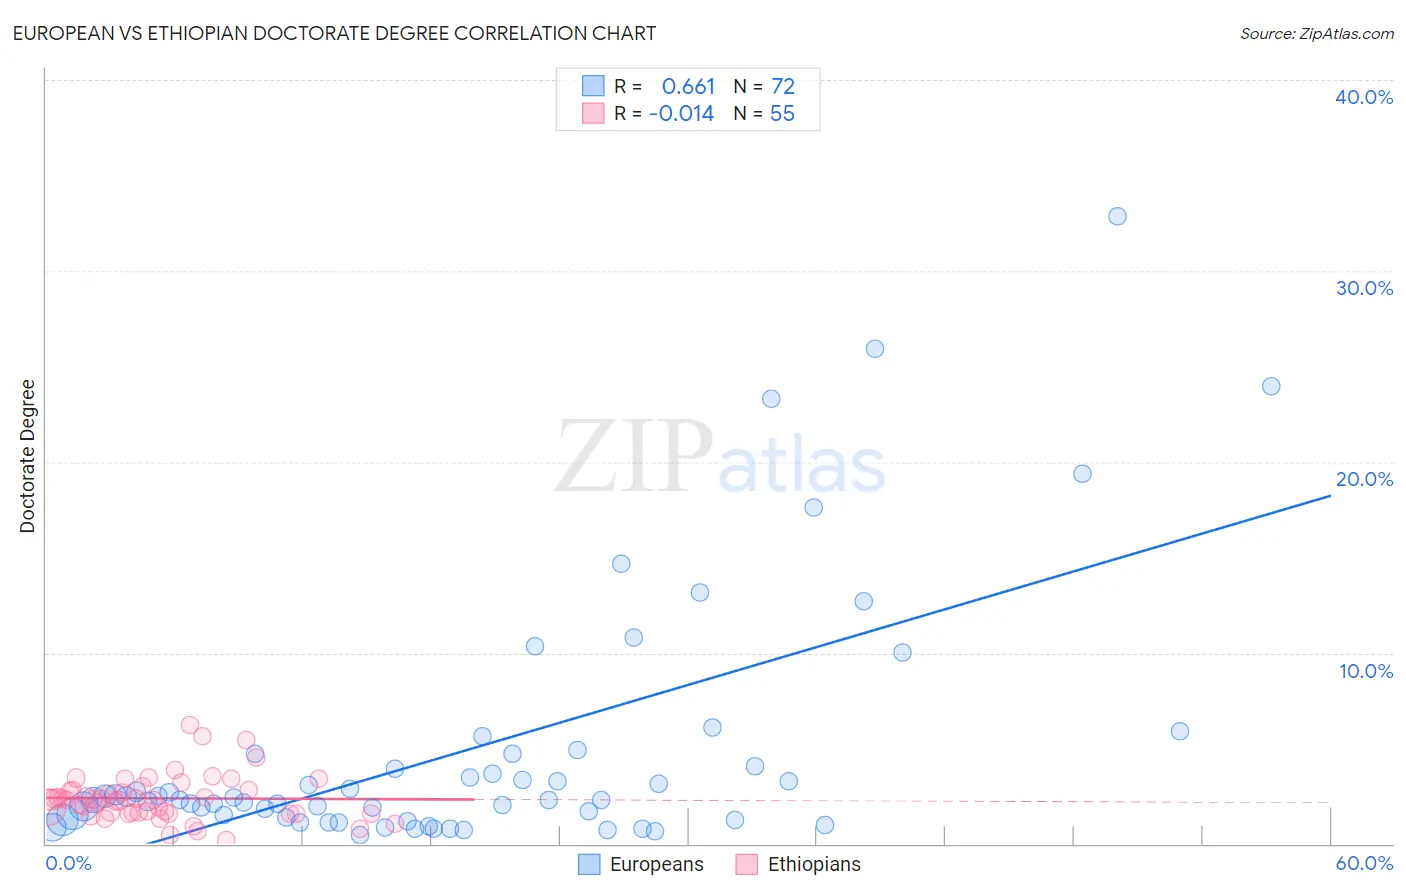
European vs Ethiopian Doctorate Degree Correlation Chart
The statistical analysis conducted on geographies consisting of 540,466,833 people shows a significant positive correlation between the proportion of Europeans and percentage of population with at least doctorate degree education in the United States with a correlation coefficient (R) of 0.661 and weighted average of 2.1%. Similarly, the statistical analysis conducted on geographies consisting of 222,399,693 people shows no correlation between the proportion of Ethiopians and percentage of population with at least doctorate degree education in the United States with a correlation coefficient (R) of -0.014 and weighted average of 2.3%, a difference of 12.7%.
Doctorate Degree Correlation Summary
| Measurement | European | Ethiopian |
| Minimum | 0.48% | 0.18% |
| Maximum | 32.8% | 6.2% |
| Range | 32.4% | 6.0% |
| Mean | 4.9% | 2.4% |
| Median | 2.3% | 2.3% |
| Interquartile 25% (IQ1) | 1.3% | 1.6% |
| Interquartile 75% (IQ3) | 4.4% | 2.8% |
| Interquartile Range (IQR) | 3.1% | 1.2% |
| Standard Deviation (Sample) | 6.6% | 1.2% |
| Standard Deviation (Population) | 6.6% | 1.2% |
Similar Demographics by Doctorate Degree
Demographics Similar to Europeans by Doctorate Degree
In terms of doctorate degree, the demographic groups most similar to Europeans are Immigrants from Germany (2.1%, a difference of 0.22%), Ukrainian (2.1%, a difference of 0.28%), Brazilian (2.1%, a difference of 0.35%), Sudanese (2.1%, a difference of 0.39%), and Immigrants from Pakistan (2.1%, a difference of 0.41%).
| Demographics | Rating | Rank | Doctorate Degree |
| Immigrants | Eastern Europe | 98.2 /100 | #100 | Exceptional 2.1% |
| Immigrants | Eastern Africa | 98.2 /100 | #101 | Exceptional 2.1% |
| Immigrants | Chile | 98.1 /100 | #102 | Exceptional 2.1% |
| Romanians | 98.1 /100 | #103 | Exceptional 2.1% |
| Austrians | 98.0 /100 | #104 | Exceptional 2.1% |
| Arabs | 97.8 /100 | #105 | Exceptional 2.1% |
| Sudanese | 97.7 /100 | #106 | Exceptional 2.1% |
| Europeans | 97.5 /100 | #107 | Exceptional 2.1% |
| Immigrants | Germany | 97.3 /100 | #108 | Exceptional 2.1% |
| Ukrainians | 97.2 /100 | #109 | Exceptional 2.1% |
| Brazilians | 97.2 /100 | #110 | Exceptional 2.1% |
| Immigrants | Pakistan | 97.1 /100 | #111 | Exceptional 2.1% |
| Syrians | 97.1 /100 | #112 | Exceptional 2.1% |
| Immigrants | Italy | 96.9 /100 | #113 | Exceptional 2.1% |
| Immigrants | Croatia | 96.8 /100 | #114 | Exceptional 2.1% |
Demographics Similar to Ethiopians by Doctorate Degree
In terms of doctorate degree, the demographic groups most similar to Ethiopians are Immigrants from Ethiopia (2.4%, a difference of 0.12%), South African (2.3%, a difference of 0.44%), Immigrants from Serbia (2.3%, a difference of 0.46%), Immigrants from Czechoslovakia (2.4%, a difference of 0.55%), and Bolivian (2.4%, a difference of 0.65%).
| Demographics | Rating | Rank | Doctorate Degree |
| Australians | 100.0 /100 | #51 | Exceptional 2.4% |
| Bulgarians | 100.0 /100 | #52 | Exceptional 2.4% |
| Immigrants | Latvia | 100.0 /100 | #53 | Exceptional 2.4% |
| Immigrants | Indonesia | 100.0 /100 | #54 | Exceptional 2.4% |
| Bolivians | 100.0 /100 | #55 | Exceptional 2.4% |
| Immigrants | Czechoslovakia | 100.0 /100 | #56 | Exceptional 2.4% |
| Immigrants | Ethiopia | 100.0 /100 | #57 | Exceptional 2.4% |
| Ethiopians | 99.9 /100 | #58 | Exceptional 2.3% |
| South Africans | 99.9 /100 | #59 | Exceptional 2.3% |
| Immigrants | Serbia | 99.9 /100 | #60 | Exceptional 2.3% |
| Bhutanese | 99.9 /100 | #61 | Exceptional 2.3% |
| Immigrants | Europe | 99.9 /100 | #62 | Exceptional 2.3% |
| Laotians | 99.9 /100 | #63 | Exceptional 2.3% |
| Immigrants | Greece | 99.9 /100 | #64 | Exceptional 2.3% |
| Paraguayans | 99.9 /100 | #65 | Exceptional 2.3% |