European vs Immigrants from Caribbean Unemployment Among Youth under 25 years

COMPARE

European
Race
Ancestry
AfghanAfricanAlaska NativeAlaskan AthabascanAlbanianAleutAlsatianAmericanApacheArabArapahoArgentineanArmenianAssyrian/Chaldean/SyriacAustralianAustrianBahamianBangladeshiBarbadianBasqueBelgianBelizeanBermudanBhutaneseBlackfeetBolivianBrazilianBritishBritish West IndianBulgarianBurmeseCajunCambodianCanadianCape VerdeanCarpatho RusynCelticCentral AmericanCentral American IndianCherokeeCheyenneChickasawChileanChineseChippewaChoctawColombianColvilleComancheCosta RicanCreeCreekCroatianCrowCubanCypriotCzechCzechoslovakianDanishDelawareDominicanDutchDutch West IndianEastern EuropeanEcuadorianEgyptianEnglishEstonianEthiopianEuropeanFijianFilipinoFinnishFrenchFrench American IndianFrench CanadianGermanGerman RussianGhanaianGreekGuamanian/ChamorroGuatemalanGuyaneseHaitianHmongHonduranHopiHoumaHungarianIcelanderIndian (Asian)IndonesianInupiatIranianIraqiIrishIroquoisIsraeliItalianJamaicanJapaneseJordanianKenyanKiowaKoreanLaotianLatvianLebaneseLiberianLithuanianLumbeeLuxembourgerMacedonianMalaysianMalteseMarshalleseMenomineeMexicanMexican American IndianMongolianMoroccanNative HawaiianNavajoNepaleseNew ZealanderNicaraguanNigerianNorthern EuropeanNorwegianOkinawanOsageOttawaPaiutePakistaniPalestinianPanamanianParaguayanPennsylvania GermanPeruvianPimaPolishPortuguesePotawatomiPuebloPuerto RicanPuget Sound SalishRomanianRussianSalvadoranSamoanScandinavianScotch-IrishScottishSeminoleSenegaleseSerbianShoshoneSierra LeoneanSiouxSlavicSlovakSloveneSomaliSouth AfricanSouth AmericanSouth American IndianSoviet UnionSpaniardSpanishSpanish AmericanSpanish American IndianSri LankanSubsaharan AfricanSudaneseSwedishSwissSyrianTaiwaneseThaiTlingit-HaidaTohono O'OdhamTonganTrinidadian and TobagonianTsimshianTurkishU.S. Virgin IslanderUgandanUkrainianUruguayanUteVenezuelanVietnameseWelshWest IndianYakamaYaquiYugoslavianYumanYup'ikZimbabwean
Immigration
NonimmigrantsImmigrantsAfghanistanAfricaAlbaniaArgentinaArmeniaAsiaAustraliaAustriaBahamasBangladeshBarbadosBelarusBelgiumBelizeBoliviaBosnia and HerzegovinaBrazilBulgariaBurma/MyanmarCabo VerdeCambodiaCameroonCanadaCentral AmericaChileChinaColombiaCongoCosta RicaCroatiaCubaCzechoslovakiaDenmarkDominicaDominican RepublicEastern AfricaEastern AsiaEastern EuropeEcuadorEgyptEl SalvadorEnglandEritreaEthiopiaEuropeFijiFranceGermanyGhanaGreeceGrenadaGuatemalaGuyanaHaitiHondurasHong KongHungaryIndiaIndonesiaIranIraqIrelandIsraelItalyJamaicaJapanJordanKazakhstanKenyaKoreaKuwaitLaosLatin AmericaLatviaLebanonLiberiaLithuaniaMalaysiaMexicoMicronesiaMiddle AfricaMoldovaMoroccoNepalNetherlandsNicaraguaNigeriaNorth AmericaNorth MacedoniaNorthern AfricaNorthern EuropeNorwayOceaniaPakistanPanamaPeruPhilippinesPolandPortugalRomaniaRussiaSaudi ArabiaScotlandSenegalSerbiaSierra LeoneSingaporeSomaliaSouth AfricaSouth AmericaSouth Central AsiaSouth Eastern AsiaSouthern EuropeSpainSri LankaSt. Vincent and the GrenadinesSudanSwedenSwitzerlandSyriaTaiwanThailandTrinidad and TobagoTurkeyUgandaUkraineUruguayUzbekistanVenezuelaVietnamWest IndiesWestern AfricaWestern AsiaWestern EuropeYemenZaireZimbabweAzores
Immigrants from Caribbean
Race
Ancestry
AfghanAfricanAlaska NativeAlaskan AthabascanAlbanianAleutAlsatianAmericanApacheArabArapahoArgentineanArmenianAssyrian/Chaldean/SyriacAustralianAustrianBahamianBangladeshiBarbadianBasqueBelgianBelizeanBermudanBhutaneseBlackfeetBolivianBrazilianBritishBritish West IndianBulgarianBurmeseCajunCambodianCanadianCape VerdeanCarpatho RusynCelticCentral AmericanCentral American IndianCherokeeCheyenneChickasawChileanChineseChippewaChoctawColombianColvilleComancheCosta RicanCreeCreekCroatianCrowCubanCypriotCzechCzechoslovakianDanishDelawareDominicanDutchDutch West IndianEastern EuropeanEcuadorianEgyptianEnglishEstonianEthiopianFijianFilipinoFinnishFrenchFrench American IndianFrench CanadianGermanGerman RussianGhanaianGreekGuamanian/ChamorroGuatemalanGuyaneseHaitianHmongHonduranHopiHoumaHungarianIcelanderIndian (Asian)IndonesianInupiatIranianIraqiIrishIroquoisIsraeliItalianJamaicanJapaneseJordanianKenyanKiowaKoreanLaotianLatvianLebaneseLiberianLithuanianLumbeeLuxembourgerMacedonianMalaysianMalteseMarshalleseMenomineeMexicanMexican American IndianMongolianMoroccanNative HawaiianNavajoNepaleseNew ZealanderNicaraguanNigerianNorthern EuropeanNorwegianOkinawanOsageOttawaPaiutePakistaniPalestinianPanamanianParaguayanPennsylvania GermanPeruvianPimaPolishPortuguesePotawatomiPuebloPuerto RicanPuget Sound SalishRomanianRussianSalvadoranSamoanScandinavianScotch-IrishScottishSeminoleSenegaleseSerbianShoshoneSierra LeoneanSiouxSlavicSlovakSloveneSomaliSouth AfricanSouth AmericanSouth American IndianSoviet UnionSpaniardSpanishSpanish AmericanSpanish American IndianSri LankanSubsaharan AfricanSudaneseSwedishSwissSyrianTaiwaneseThaiTlingit-HaidaTohono O'OdhamTonganTrinidadian and TobagonianTsimshianTurkishU.S. Virgin IslanderUgandanUkrainianUruguayanUteVenezuelanVietnameseWelshWest IndianYakamaYaquiYugoslavianYumanYup'ikZimbabwean
Immigration
NonimmigrantsImmigrantsAfghanistanAfricaAlbaniaArgentinaArmeniaAsiaAustraliaAustriaBahamasBangladeshBarbadosBelarusBelgiumBelizeBoliviaBosnia and HerzegovinaBrazilBulgariaBurma/MyanmarCabo VerdeCambodiaCameroonCanadaCaribbeanCentral AmericaChileChinaColombiaCongoCosta RicaCroatiaCubaCzechoslovakiaDenmarkDominicaDominican RepublicEastern AfricaEastern AsiaEastern EuropeEcuadorEgyptEl SalvadorEnglandEritreaEthiopiaEuropeFijiFranceGermanyGhanaGreeceGrenadaGuatemalaGuyanaHaitiHondurasHong KongHungaryIndiaIndonesiaIranIraqIrelandIsraelItalyJamaicaJapanJordanKazakhstanKenyaKoreaKuwaitLaosLatin AmericaLatviaLebanonLiberiaLithuaniaMalaysiaMexicoMicronesiaMiddle AfricaMoldovaMoroccoNepalNetherlandsNicaraguaNigeriaNorth AmericaNorth MacedoniaNorthern AfricaNorthern EuropeNorwayOceaniaPakistanPanamaPeruPhilippinesPolandPortugalRomaniaRussiaSaudi ArabiaScotlandSenegalSerbiaSierra LeoneSingaporeSomaliaSouth AfricaSouth AmericaSouth Central AsiaSouth Eastern AsiaSouthern EuropeSpainSri LankaSt. Vincent and the GrenadinesSudanSwedenSwitzerlandSyriaTaiwanThailandTrinidad and TobagoTurkeyUgandaUkraineUruguayUzbekistanVenezuelaVietnamWest IndiesWestern AfricaWestern AsiaWestern EuropeYemenZaireZimbabweAzores
Unemployment Among Youth under 25 years
Income
Poverty
Unemployment
Labor Participation
Family Structure
Vehicle Availability
Education Level
Disability

Unemployment Among Youth under 25 years Comparison

Europeans

Immigrants from Caribbean

Exceptional
Tragic
10.8%
UNEMPLOYMENT AMONG YOUTH UNDER 25 YEARS
99.9/ 100
METRIC RATING
33rd/ 347
METRIC RANK
13.5%
UNEMPLOYMENT AMONG YOUTH UNDER 25 YEARS
0.0/ 100
METRIC RATING
294th/ 347
METRIC RANK

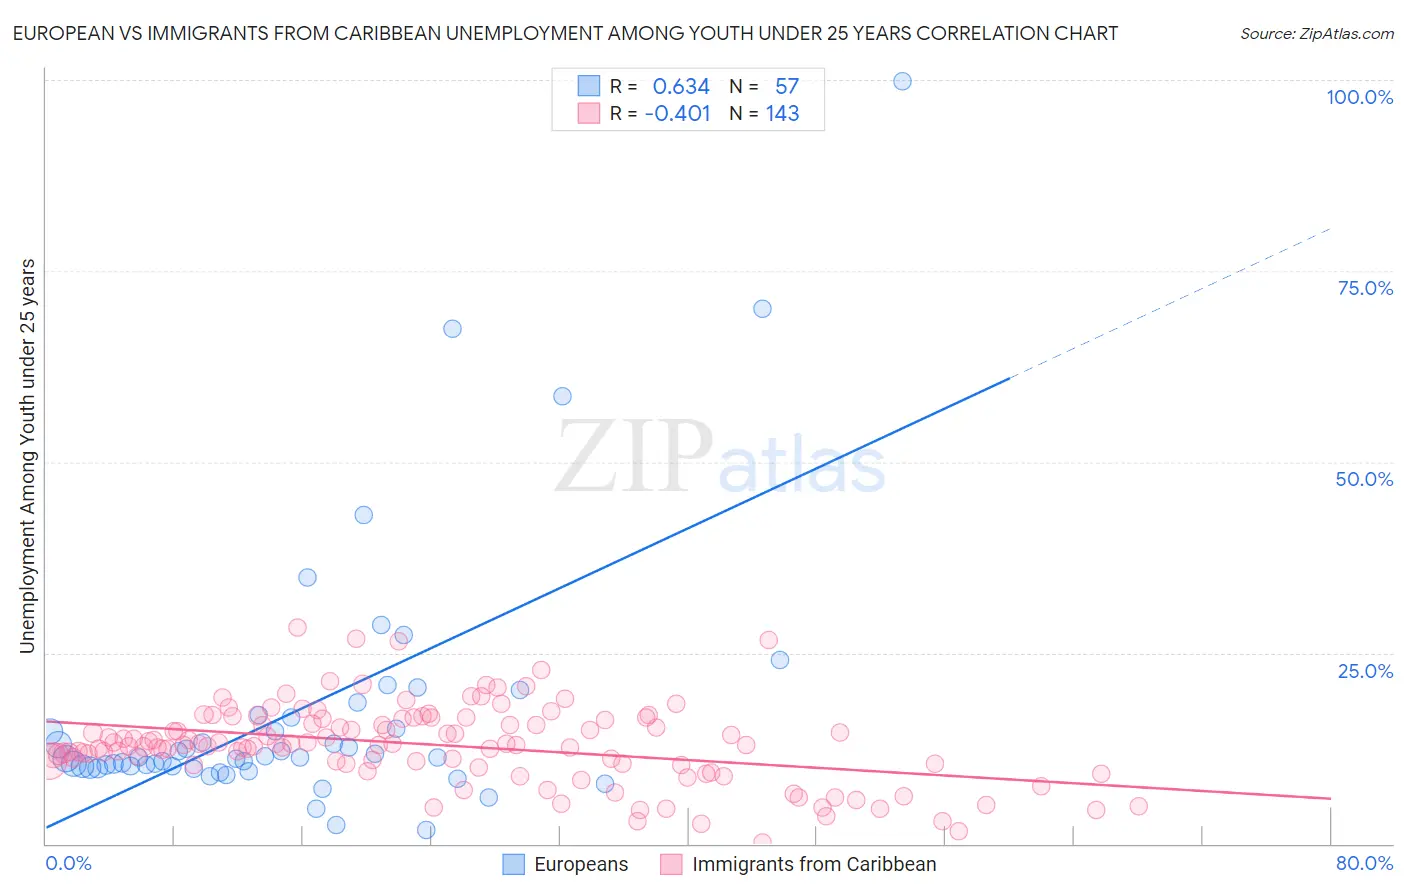
European vs Immigrants from Caribbean Unemployment Among Youth under 25 years Correlation Chart

The statistical analysis conducted on geographies consisting of 539,832,325 people shows a significant positive correlation between the proportion of Europeans and unemployment rate among youth under the age of 25 in the United States with a correlation coefficient (R) of 0.634 and weighted average of 10.8%. Similarly, the statistical analysis conducted on geographies consisting of 442,870,583 people shows a moderate negative correlation between the proportion of Immigrants from Caribbean and unemployment rate among youth under the age of 25 in the United States with a correlation coefficient (R) of -0.401 and weighted average of 13.5%, a difference of 25.2%.
European vs Immigrants from Caribbean Unemployment Among Youth under 25 years

Unemployment Among Youth under 25 years Correlation Summary

MeasurementEuropeanImmigrants from Caribbean
Minimum1.8%0.10%
Maximum99.9%28.3%
Range98.1%28.2%
Mean17.5%12.9%
Median11.3%12.9%
Interquartile 25% (IQ1)10.1%10.4%
Interquartile 75% (IQ3)16.7%16.4%
Interquartile Range (IQR)6.6%6.0%
Standard Deviation (Sample)17.7%5.1%
Standard Deviation (Population)17.5%5.1%

Similar Demographics by Unemployment Among Youth under 25 years

Demographics Similar to Europeans by Unemployment Among Youth under 25 years

In terms of unemployment among youth under 25 years, the demographic groups most similar to Europeans are Taiwanese (10.8%, a difference of 0.22%), English (10.8%, a difference of 0.27%), Immigrants from Nepal (10.8%, a difference of 0.35%), Slovene (10.7%, a difference of 0.48%), and Hmong (10.8%, a difference of 0.48%).
DemographicsRating | RankUnemployment Among Youth under 25 years
Immigrants | India
100.0
/100
|
#26
Exceptional
10.7%
Yugoslavians
100.0
/100
|
#27
Exceptional
10.7%
Somalis
100.0
/100
|
#28
Exceptional
10.7%
Chinese
99.9
/100
|
#29
Exceptional
10.7%
Osage
99.9
/100
|
#30
Exceptional
10.7%
Slovenes
99.9
/100
|
#31
Exceptional
10.7%
Taiwanese
99.9
/100
|
#32
Exceptional
10.8%
Europeans
99.9
/100
|
#33
Exceptional
10.8%
English
99.9
/100
|
#34
Exceptional
10.8%
Immigrants | Nepal
99.9
/100
|
#35
Exceptional
10.8%
Hmong
99.8
/100
|
#36
Exceptional
10.8%
Immigrants | Zimbabwe
99.8
/100
|
#37
Exceptional
10.8%
Immigrants | Congo
99.8
/100
|
#38
Exceptional
10.9%
Immigrants | Zaire
99.8
/100
|
#39
Exceptional
10.9%
Scottish
99.8
/100
|
#40
Exceptional
10.9%

Demographics Similar to Immigrants from Caribbean by Unemployment Among Youth under 25 years

In terms of unemployment among youth under 25 years, the demographic groups most similar to Immigrants from Caribbean are Spanish American Indian (13.5%, a difference of 0.16%), Chippewa (13.5%, a difference of 0.24%), Senegalese (13.5%, a difference of 0.26%), Central American Indian (13.5%, a difference of 0.27%), and Apache (13.5%, a difference of 0.31%).
DemographicsRating | RankUnemployment Among Youth under 25 years
Ecuadorians
0.0
/100
|
#287
Tragic
13.3%
Immigrants | Western Africa
0.0
/100
|
#288
Tragic
13.4%
Immigrants | Ghana
0.0
/100
|
#289
Tragic
13.4%
Immigrants | Ecuador
0.0
/100
|
#290
Tragic
13.4%
Apache
0.0
/100
|
#291
Tragic
13.5%
Central American Indians
0.0
/100
|
#292
Tragic
13.5%
Spanish American Indians
0.0
/100
|
#293
Tragic
13.5%
Immigrants | Caribbean
0.0
/100
|
#294
Tragic
13.5%
Chippewa
0.0
/100
|
#295
Tragic
13.5%
Senegalese
0.0
/100
|
#296
Tragic
13.5%
U.S. Virgin Islanders
0.0
/100
|
#297
Tragic
13.6%
Shoshone
0.0
/100
|
#298
Tragic
13.7%
Tohono O'odham
0.0
/100
|
#299
Tragic
13.8%
Immigrants | Cabo Verde
0.0
/100
|
#300
Tragic
13.8%
Immigrants | Senegal
0.0
/100
|
#301
Tragic
13.8%