European vs Immigrants from Caribbean Unemployment Among Women with Children Under 6 years
COMPARE
European
Immigrants from Caribbean
Unemployment Among Women with Children Under 6 years
Unemployment Among Women with Children Under 6 years Comparison
Europeans
Immigrants from Caribbean
7.5%
UNEMPLOYMENT AMONG WOMEN WITH CHILDREN UNDER 6 YEARS
79.1/ 100
METRIC RATING
144th/ 347
METRIC RANK
8.3%
UNEMPLOYMENT AMONG WOMEN WITH CHILDREN UNDER 6 YEARS
0.7/ 100
METRIC RATING
254th/ 347
METRIC RANK
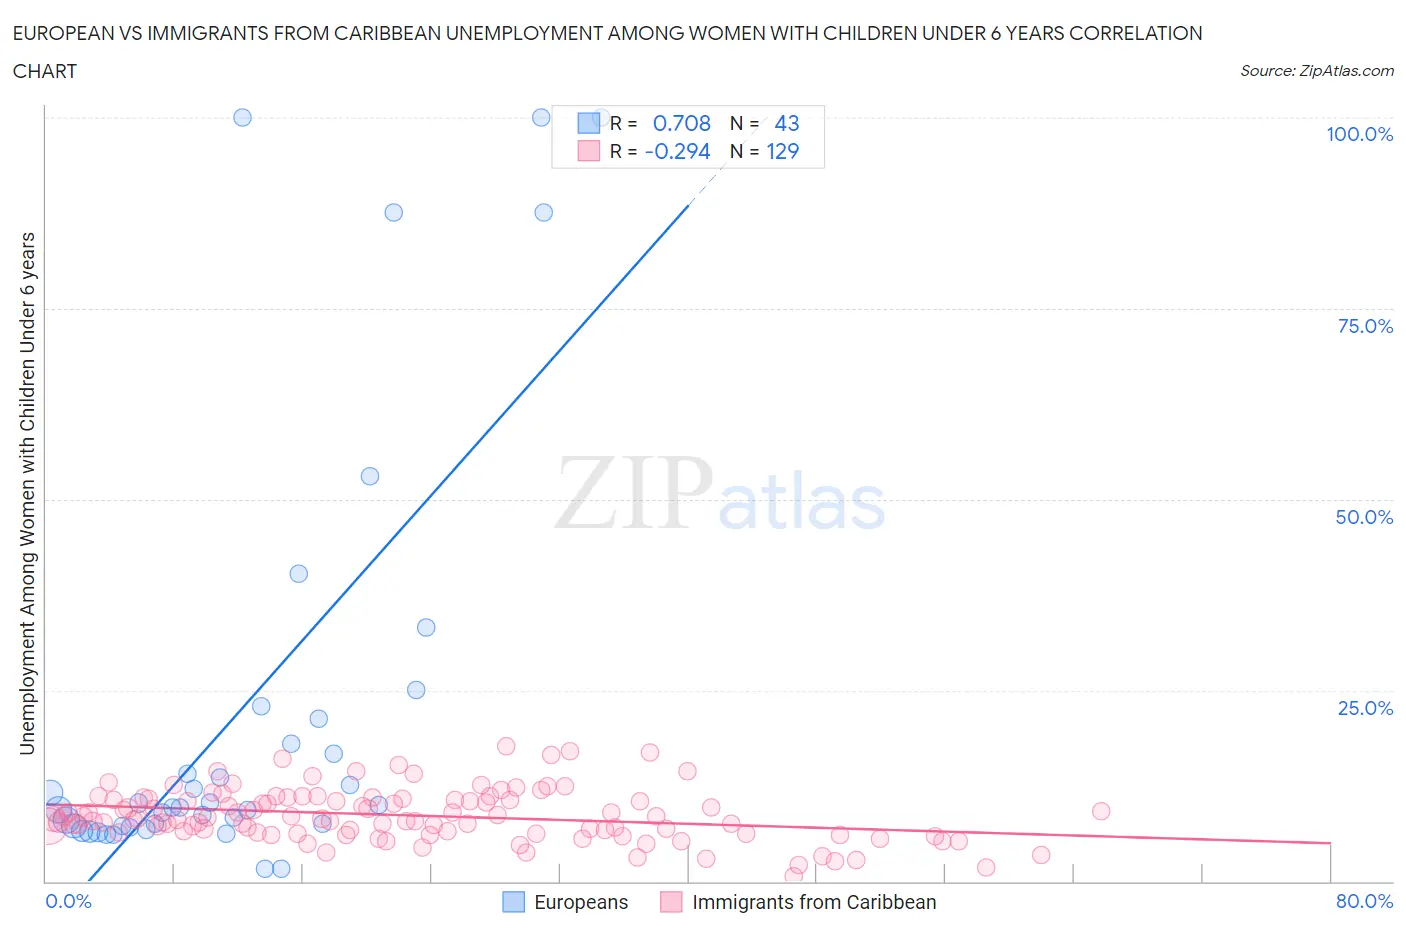
European vs Immigrants from Caribbean Unemployment Among Women with Children Under 6 years Correlation Chart
The statistical analysis conducted on geographies consisting of 373,796,312 people shows a strong positive correlation between the proportion of Europeans and unemployment rate among women with children under the age of 6 in the United States with a correlation coefficient (R) of 0.708 and weighted average of 7.5%. Similarly, the statistical analysis conducted on geographies consisting of 333,938,519 people shows a weak negative correlation between the proportion of Immigrants from Caribbean and unemployment rate among women with children under the age of 6 in the United States with a correlation coefficient (R) of -0.294 and weighted average of 8.3%, a difference of 10.6%.
Unemployment Among Women with Children Under 6 years Correlation Summary
| Measurement | European | Immigrants from Caribbean |
| Minimum | 1.6% | 0.70% |
| Maximum | 100.0% | 17.6% |
| Range | 98.4% | 16.9% |
| Mean | 22.3% | 8.6% |
| Median | 9.7% | 8.2% |
| Interquartile 25% (IQ1) | 7.2% | 6.4% |
| Interquartile 75% (IQ3) | 21.3% | 10.7% |
| Interquartile Range (IQR) | 14.1% | 4.3% |
| Standard Deviation (Sample) | 28.5% | 3.3% |
| Standard Deviation (Population) | 28.2% | 3.3% |
Similar Demographics by Unemployment Among Women with Children Under 6 years
Demographics Similar to Europeans by Unemployment Among Women with Children Under 6 years
In terms of unemployment among women with children under 6 years, the demographic groups most similar to Europeans are Immigrants from Jordan (7.5%, a difference of 0.030%), Japanese (7.5%, a difference of 0.030%), Immigrants from Oceania (7.5%, a difference of 0.070%), Immigrants from Brazil (7.5%, a difference of 0.18%), and Korean (7.5%, a difference of 0.24%).
| Demographics | Rating | Rank | Unemployment Among Women with Children Under 6 years |
| Immigrants | Cambodia | 84.6 /100 | #137 | Excellent 7.4% |
| Immigrants | Norway | 84.1 /100 | #138 | Excellent 7.4% |
| Immigrants | Colombia | 83.9 /100 | #139 | Excellent 7.4% |
| Scandinavians | 83.0 /100 | #140 | Excellent 7.4% |
| Greeks | 82.6 /100 | #141 | Excellent 7.4% |
| Immigrants | Argentina | 81.5 /100 | #142 | Excellent 7.5% |
| Koreans | 81.3 /100 | #143 | Excellent 7.5% |
| Europeans | 79.1 /100 | #144 | Good 7.5% |
| Immigrants | Jordan | 78.9 /100 | #145 | Good 7.5% |
| Japanese | 78.9 /100 | #146 | Good 7.5% |
| Immigrants | Oceania | 78.4 /100 | #147 | Good 7.5% |
| Immigrants | Brazil | 77.3 /100 | #148 | Good 7.5% |
| Colombians | 76.1 /100 | #149 | Good 7.5% |
| Aleuts | 76.0 /100 | #150 | Good 7.5% |
| Immigrants | Peru | 74.9 /100 | #151 | Good 7.5% |
Demographics Similar to Immigrants from Caribbean by Unemployment Among Women with Children Under 6 years
In terms of unemployment among women with children under 6 years, the demographic groups most similar to Immigrants from Caribbean are Immigrants from Guyana (8.2%, a difference of 0.27%), Immigrants from Portugal (8.3%, a difference of 0.29%), Celtic (8.3%, a difference of 0.31%), Guyanese (8.2%, a difference of 0.44%), and Ghanaian (8.2%, a difference of 0.44%).
| Demographics | Rating | Rank | Unemployment Among Women with Children Under 6 years |
| German Russians | 1.2 /100 | #247 | Tragic 8.2% |
| Immigrants | Western Africa | 1.1 /100 | #248 | Tragic 8.2% |
| Immigrants | Sierra Leone | 1.1 /100 | #249 | Tragic 8.2% |
| Nigerians | 1.1 /100 | #250 | Tragic 8.2% |
| Guyanese | 1.0 /100 | #251 | Tragic 8.2% |
| Ghanaians | 1.0 /100 | #252 | Tragic 8.2% |
| Immigrants | Guyana | 0.8 /100 | #253 | Tragic 8.2% |
| Immigrants | Caribbean | 0.7 /100 | #254 | Tragic 8.3% |
| Immigrants | Portugal | 0.6 /100 | #255 | Tragic 8.3% |
| Celtics | 0.6 /100 | #256 | Tragic 8.3% |
| British West Indians | 0.5 /100 | #257 | Tragic 8.3% |
| Immigrants | Ghana | 0.5 /100 | #258 | Tragic 8.3% |
| Barbadians | 0.4 /100 | #259 | Tragic 8.3% |
| Whites/Caucasians | 0.3 /100 | #260 | Tragic 8.4% |
| Immigrants | Liberia | 0.3 /100 | #261 | Tragic 8.4% |