Carpatho Rusyn vs Ethiopian Doctorate Degree
COMPARE
Carpatho Rusyn
Ethiopian
Doctorate Degree
Doctorate Degree Comparison
Carpatho Rusyns
Ethiopians
2.3%
DOCTORATE DEGREE
99.8/ 100
METRIC RATING
69th/ 347
METRIC RANK
2.3%
DOCTORATE DEGREE
99.9/ 100
METRIC RATING
58th/ 347
METRIC RANK
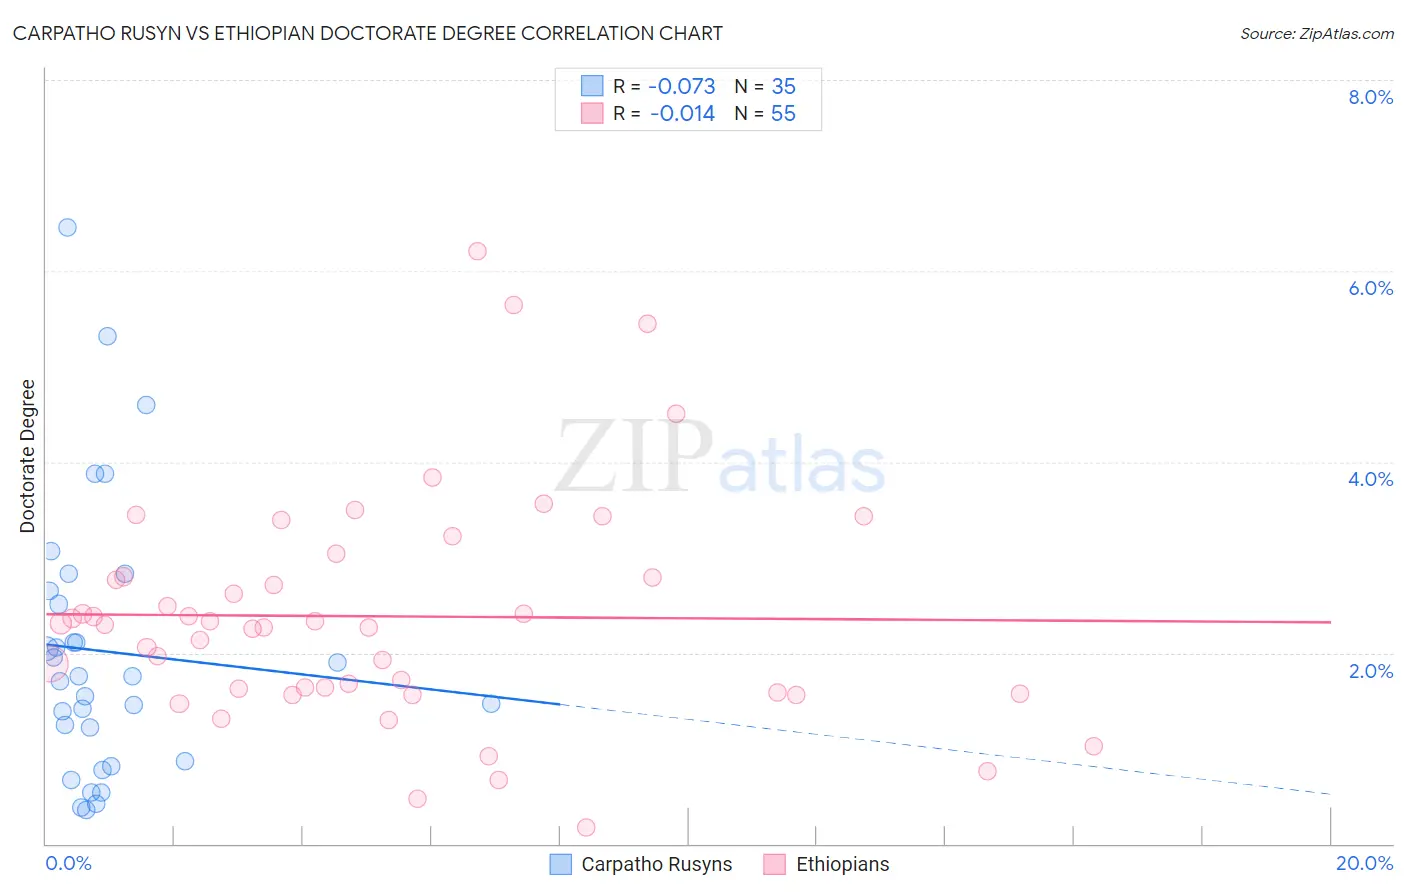
Carpatho Rusyn vs Ethiopian Doctorate Degree Correlation Chart
The statistical analysis conducted on geographies consisting of 58,704,885 people shows a slight negative correlation between the proportion of Carpatho Rusyns and percentage of population with at least doctorate degree education in the United States with a correlation coefficient (R) of -0.073 and weighted average of 2.3%. Similarly, the statistical analysis conducted on geographies consisting of 222,399,693 people shows no correlation between the proportion of Ethiopians and percentage of population with at least doctorate degree education in the United States with a correlation coefficient (R) of -0.014 and weighted average of 2.3%, a difference of 3.9%.
Doctorate Degree Correlation Summary
| Measurement | Carpatho Rusyn | Ethiopian |
| Minimum | 0.35% | 0.18% |
| Maximum | 6.5% | 6.2% |
| Range | 6.1% | 6.0% |
| Mean | 2.0% | 2.4% |
| Median | 1.8% | 2.3% |
| Interquartile 25% (IQ1) | 0.86% | 1.6% |
| Interquartile 75% (IQ3) | 2.6% | 2.8% |
| Interquartile Range (IQR) | 1.8% | 1.2% |
| Standard Deviation (Sample) | 1.4% | 1.2% |
| Standard Deviation (Population) | 1.4% | 1.2% |
Demographics Similar to Carpatho Rusyns and Ethiopians by Doctorate Degree
In terms of doctorate degree, the demographic groups most similar to Carpatho Rusyns are Lithuanian (2.3%, a difference of 0.14%), Immigrants from Bolivia (2.3%, a difference of 0.14%), Immigrants from Kazakhstan (2.3%, a difference of 0.25%), Immigrants from Canada (2.3%, a difference of 0.30%), and Immigrants from Bulgaria (2.3%, a difference of 0.38%). Similarly, the demographic groups most similar to Ethiopians are Immigrants from Ethiopia (2.4%, a difference of 0.12%), South African (2.3%, a difference of 0.44%), Immigrants from Serbia (2.3%, a difference of 0.46%), Immigrants from Czechoslovakia (2.4%, a difference of 0.55%), and Bolivian (2.4%, a difference of 0.65%).
| Demographics | Rating | Rank | Doctorate Degree |
| Immigrants | Latvia | 100.0 /100 | #53 | Exceptional 2.4% |
| Immigrants | Indonesia | 100.0 /100 | #54 | Exceptional 2.4% |
| Bolivians | 100.0 /100 | #55 | Exceptional 2.4% |
| Immigrants | Czechoslovakia | 100.0 /100 | #56 | Exceptional 2.4% |
| Immigrants | Ethiopia | 100.0 /100 | #57 | Exceptional 2.4% |
| Ethiopians | 99.9 /100 | #58 | Exceptional 2.3% |
| South Africans | 99.9 /100 | #59 | Exceptional 2.3% |
| Immigrants | Serbia | 99.9 /100 | #60 | Exceptional 2.3% |
| Bhutanese | 99.9 /100 | #61 | Exceptional 2.3% |
| Immigrants | Europe | 99.9 /100 | #62 | Exceptional 2.3% |
| Laotians | 99.9 /100 | #63 | Exceptional 2.3% |
| Immigrants | Greece | 99.9 /100 | #64 | Exceptional 2.3% |
| Paraguayans | 99.9 /100 | #65 | Exceptional 2.3% |
| Argentineans | 99.9 /100 | #66 | Exceptional 2.3% |
| Zimbabweans | 99.8 /100 | #67 | Exceptional 2.3% |
| Immigrants | Kazakhstan | 99.8 /100 | #68 | Exceptional 2.3% |
| Carpatho Rusyns | 99.8 /100 | #69 | Exceptional 2.3% |
| Lithuanians | 99.8 /100 | #70 | Exceptional 2.3% |
| Immigrants | Bolivia | 99.8 /100 | #71 | Exceptional 2.3% |
| Immigrants | Canada | 99.8 /100 | #72 | Exceptional 2.3% |
| Immigrants | Bulgaria | 99.8 /100 | #73 | Exceptional 2.3% |