Honduran vs Ethiopian Doctorate Degree
COMPARE
Honduran
Ethiopian
Doctorate Degree
Doctorate Degree Comparison
Hondurans
Ethiopians
1.4%
DOCTORATE DEGREE
0.1/ 100
METRIC RATING
301st/ 347
METRIC RANK
2.3%
DOCTORATE DEGREE
99.9/ 100
METRIC RATING
58th/ 347
METRIC RANK
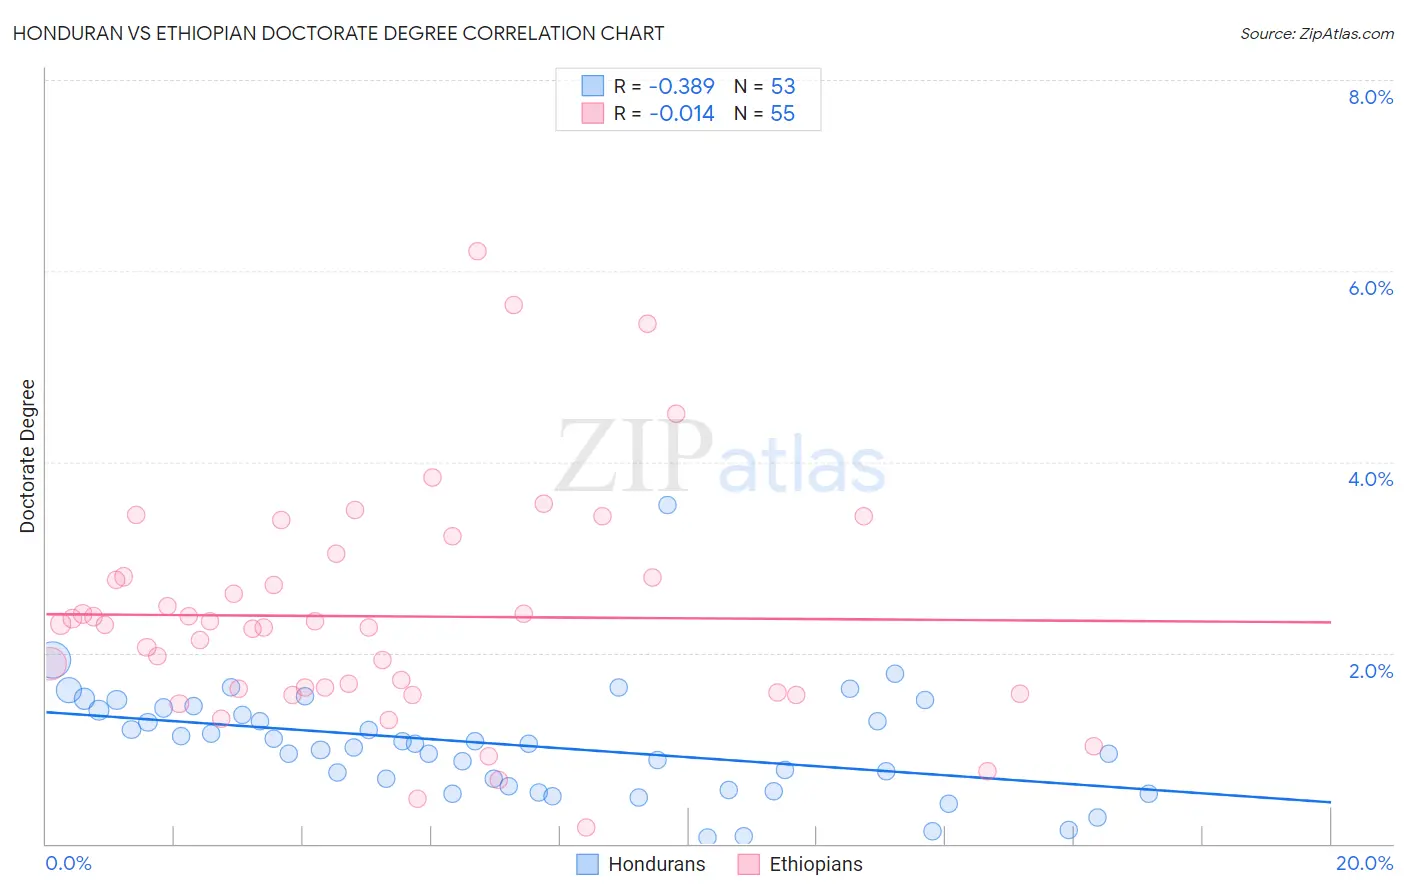
Honduran vs Ethiopian Doctorate Degree Correlation Chart
The statistical analysis conducted on geographies consisting of 353,493,609 people shows a mild negative correlation between the proportion of Hondurans and percentage of population with at least doctorate degree education in the United States with a correlation coefficient (R) of -0.389 and weighted average of 1.4%. Similarly, the statistical analysis conducted on geographies consisting of 222,399,693 people shows no correlation between the proportion of Ethiopians and percentage of population with at least doctorate degree education in the United States with a correlation coefficient (R) of -0.014 and weighted average of 2.3%, a difference of 69.3%.
Doctorate Degree Correlation Summary
| Measurement | Honduran | Ethiopian |
| Minimum | 0.068% | 0.18% |
| Maximum | 3.5% | 6.2% |
| Range | 3.5% | 6.0% |
| Mean | 1.0% | 2.4% |
| Median | 1.0% | 2.3% |
| Interquartile 25% (IQ1) | 0.59% | 1.6% |
| Interquartile 75% (IQ3) | 1.4% | 2.8% |
| Interquartile Range (IQR) | 0.82% | 1.2% |
| Standard Deviation (Sample) | 0.59% | 1.2% |
| Standard Deviation (Population) | 0.58% | 1.2% |
Similar Demographics by Doctorate Degree
Demographics Similar to Hondurans by Doctorate Degree
In terms of doctorate degree, the demographic groups most similar to Hondurans are Immigrants from Guatemala (1.4%, a difference of 0.070%), Shoshone (1.4%, a difference of 0.33%), Immigrants from Dominica (1.4%, a difference of 0.36%), Belizean (1.4%, a difference of 0.40%), and Mexican American Indian (1.4%, a difference of 0.42%).
| Demographics | Rating | Rank | Doctorate Degree |
| Samoans | 0.2 /100 | #294 | Tragic 1.4% |
| Guatemalans | 0.2 /100 | #295 | Tragic 1.4% |
| Immigrants | Ecuador | 0.2 /100 | #296 | Tragic 1.4% |
| Tsimshian | 0.2 /100 | #297 | Tragic 1.4% |
| Puerto Ricans | 0.1 /100 | #298 | Tragic 1.4% |
| Belizeans | 0.1 /100 | #299 | Tragic 1.4% |
| Immigrants | Guatemala | 0.1 /100 | #300 | Tragic 1.4% |
| Hondurans | 0.1 /100 | #301 | Tragic 1.4% |
| Shoshone | 0.1 /100 | #302 | Tragic 1.4% |
| Immigrants | Dominica | 0.1 /100 | #303 | Tragic 1.4% |
| Mexican American Indians | 0.1 /100 | #304 | Tragic 1.4% |
| Pennsylvania Germans | 0.1 /100 | #305 | Tragic 1.4% |
| Guyanese | 0.1 /100 | #306 | Tragic 1.4% |
| Cubans | 0.1 /100 | #307 | Tragic 1.4% |
| Immigrants | Laos | 0.1 /100 | #308 | Tragic 1.4% |
Demographics Similar to Ethiopians by Doctorate Degree
In terms of doctorate degree, the demographic groups most similar to Ethiopians are Immigrants from Ethiopia (2.4%, a difference of 0.12%), South African (2.3%, a difference of 0.44%), Immigrants from Serbia (2.3%, a difference of 0.46%), Immigrants from Czechoslovakia (2.4%, a difference of 0.55%), and Bolivian (2.4%, a difference of 0.65%).
| Demographics | Rating | Rank | Doctorate Degree |
| Australians | 100.0 /100 | #51 | Exceptional 2.4% |
| Bulgarians | 100.0 /100 | #52 | Exceptional 2.4% |
| Immigrants | Latvia | 100.0 /100 | #53 | Exceptional 2.4% |
| Immigrants | Indonesia | 100.0 /100 | #54 | Exceptional 2.4% |
| Bolivians | 100.0 /100 | #55 | Exceptional 2.4% |
| Immigrants | Czechoslovakia | 100.0 /100 | #56 | Exceptional 2.4% |
| Immigrants | Ethiopia | 100.0 /100 | #57 | Exceptional 2.4% |
| Ethiopians | 99.9 /100 | #58 | Exceptional 2.3% |
| South Africans | 99.9 /100 | #59 | Exceptional 2.3% |
| Immigrants | Serbia | 99.9 /100 | #60 | Exceptional 2.3% |
| Bhutanese | 99.9 /100 | #61 | Exceptional 2.3% |
| Immigrants | Europe | 99.9 /100 | #62 | Exceptional 2.3% |
| Laotians | 99.9 /100 | #63 | Exceptional 2.3% |
| Immigrants | Greece | 99.9 /100 | #64 | Exceptional 2.3% |
| Paraguayans | 99.9 /100 | #65 | Exceptional 2.3% |