Immigrants from Mexico vs Trinidadian and Tobagonian 5th Grade
COMPARE
Immigrants from Mexico
Trinidadian and Tobagonian
5th Grade
5th Grade Comparison
Immigrants from Mexico
Trinidadians and Tobagonians
94.6%
5TH GRADE
0.0/ 100
METRIC RATING
344th/ 347
METRIC RANK
96.7%
5TH GRADE
0.1/ 100
METRIC RATING
272nd/ 347
METRIC RANK
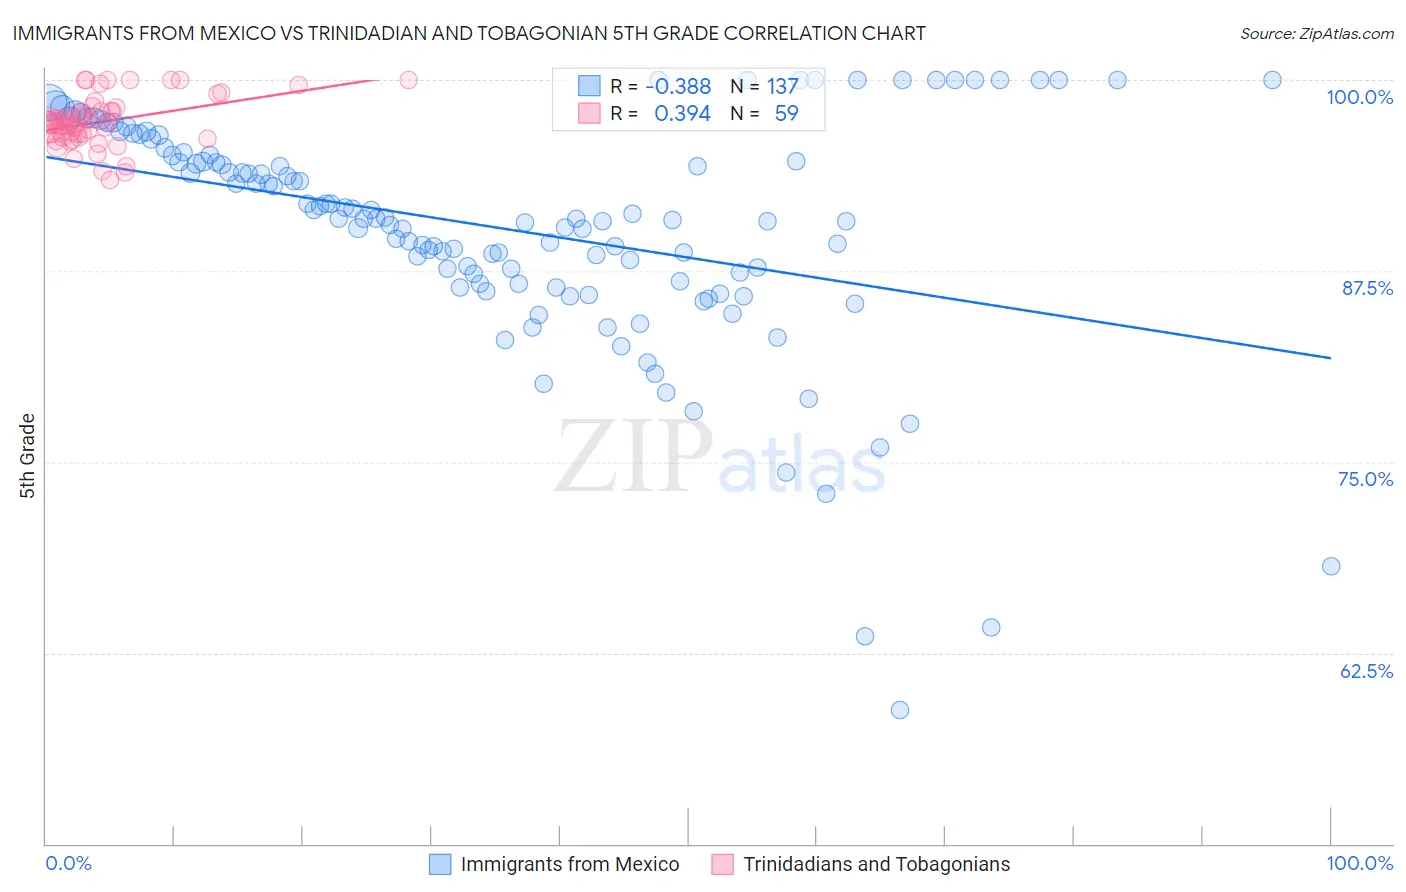
Immigrants from Mexico vs Trinidadian and Tobagonian 5th Grade Correlation Chart
The statistical analysis conducted on geographies consisting of 513,767,628 people shows a mild negative correlation between the proportion of Immigrants from Mexico and percentage of population with at least 5th grade education in the United States with a correlation coefficient (R) of -0.388 and weighted average of 94.6%. Similarly, the statistical analysis conducted on geographies consisting of 219,882,819 people shows a mild positive correlation between the proportion of Trinidadians and Tobagonians and percentage of population with at least 5th grade education in the United States with a correlation coefficient (R) of 0.394 and weighted average of 96.7%, a difference of 2.2%.
5th Grade Correlation Summary
| Measurement | Immigrants from Mexico | Trinidadian and Tobagonian |
| Minimum | 58.8% | 93.4% |
| Maximum | 100.0% | 100.0% |
| Range | 41.2% | 6.6% |
| Mean | 90.3% | 97.3% |
| Median | 90.9% | 97.2% |
| Interquartile 25% (IQ1) | 86.8% | 96.3% |
| Interquartile 75% (IQ3) | 95.2% | 98.0% |
| Interquartile Range (IQR) | 8.4% | 1.7% |
| Standard Deviation (Sample) | 7.5% | 1.6% |
| Standard Deviation (Population) | 7.5% | 1.6% |
Similar Demographics by 5th Grade
Demographics Similar to Immigrants from Mexico by 5th Grade
In terms of 5th grade, the demographic groups most similar to Immigrants from Mexico are Salvadoran (94.6%, a difference of 0.0%), Immigrants from Guatemala (94.6%, a difference of 0.010%), Immigrants from Central America (94.7%, a difference of 0.060%), Yakama (94.8%, a difference of 0.16%), and Guatemalan (94.8%, a difference of 0.24%).
| Demographics | Rating | Rank | 5th Grade |
| Immigrants | Latin America | 0.0 /100 | #333 | Tragic 95.3% |
| Nepalese | 0.0 /100 | #334 | Tragic 95.2% |
| Mexicans | 0.0 /100 | #335 | Tragic 95.2% |
| Immigrants | Azores | 0.0 /100 | #336 | Tragic 95.1% |
| Central Americans | 0.0 /100 | #337 | Tragic 95.1% |
| Immigrants | Cabo Verde | 0.0 /100 | #338 | Tragic 94.9% |
| Immigrants | Yemen | 0.0 /100 | #339 | Tragic 94.9% |
| Guatemalans | 0.0 /100 | #340 | Tragic 94.8% |
| Yakama | 0.0 /100 | #341 | Tragic 94.8% |
| Immigrants | Central America | 0.0 /100 | #342 | Tragic 94.7% |
| Salvadorans | 0.0 /100 | #343 | Tragic 94.6% |
| Immigrants | Mexico | 0.0 /100 | #344 | Tragic 94.6% |
| Immigrants | Guatemala | 0.0 /100 | #345 | Tragic 94.6% |
| Immigrants | El Salvador | 0.0 /100 | #346 | Tragic 94.3% |
| Spanish American Indians | 0.0 /100 | #347 | Tragic 94.2% |
Demographics Similar to Trinidadians and Tobagonians by 5th Grade
In terms of 5th grade, the demographic groups most similar to Trinidadians and Tobagonians are Immigrants from Hong Kong (96.7%, a difference of 0.010%), Yaqui (96.7%, a difference of 0.010%), Immigrants from Cameroon (96.7%, a difference of 0.010%), Afghan (96.7%, a difference of 0.020%), and Immigrants from Peru (96.6%, a difference of 0.020%).
| Demographics | Rating | Rank | 5th Grade |
| Taiwanese | 0.3 /100 | #265 | Tragic 96.7% |
| Immigrants | Nigeria | 0.3 /100 | #266 | Tragic 96.7% |
| Immigrants | South America | 0.3 /100 | #267 | Tragic 96.7% |
| Armenians | 0.3 /100 | #268 | Tragic 96.7% |
| Ghanaians | 0.2 /100 | #269 | Tragic 96.7% |
| Afghans | 0.2 /100 | #270 | Tragic 96.7% |
| Immigrants | Hong Kong | 0.2 /100 | #271 | Tragic 96.7% |
| Trinidadians and Tobagonians | 0.1 /100 | #272 | Tragic 96.7% |
| Yaqui | 0.1 /100 | #273 | Tragic 96.7% |
| Immigrants | Cameroon | 0.1 /100 | #274 | Tragic 96.7% |
| Immigrants | Peru | 0.1 /100 | #275 | Tragic 96.6% |
| Cubans | 0.1 /100 | #276 | Tragic 96.6% |
| Immigrants | Bolivia | 0.1 /100 | #277 | Tragic 96.6% |
| Immigrants | Ghana | 0.1 /100 | #278 | Tragic 96.6% |
| Immigrants | Philippines | 0.1 /100 | #279 | Tragic 96.6% |