Hmong vs Trinidadian and Tobagonian 5th Grade
COMPARE
Hmong
Trinidadian and Tobagonian
5th Grade
5th Grade Comparison
Hmong
Trinidadians and Tobagonians
97.6%
5TH GRADE
92.3/ 100
METRIC RATING
126th/ 347
METRIC RANK
96.7%
5TH GRADE
0.1/ 100
METRIC RATING
272nd/ 347
METRIC RANK
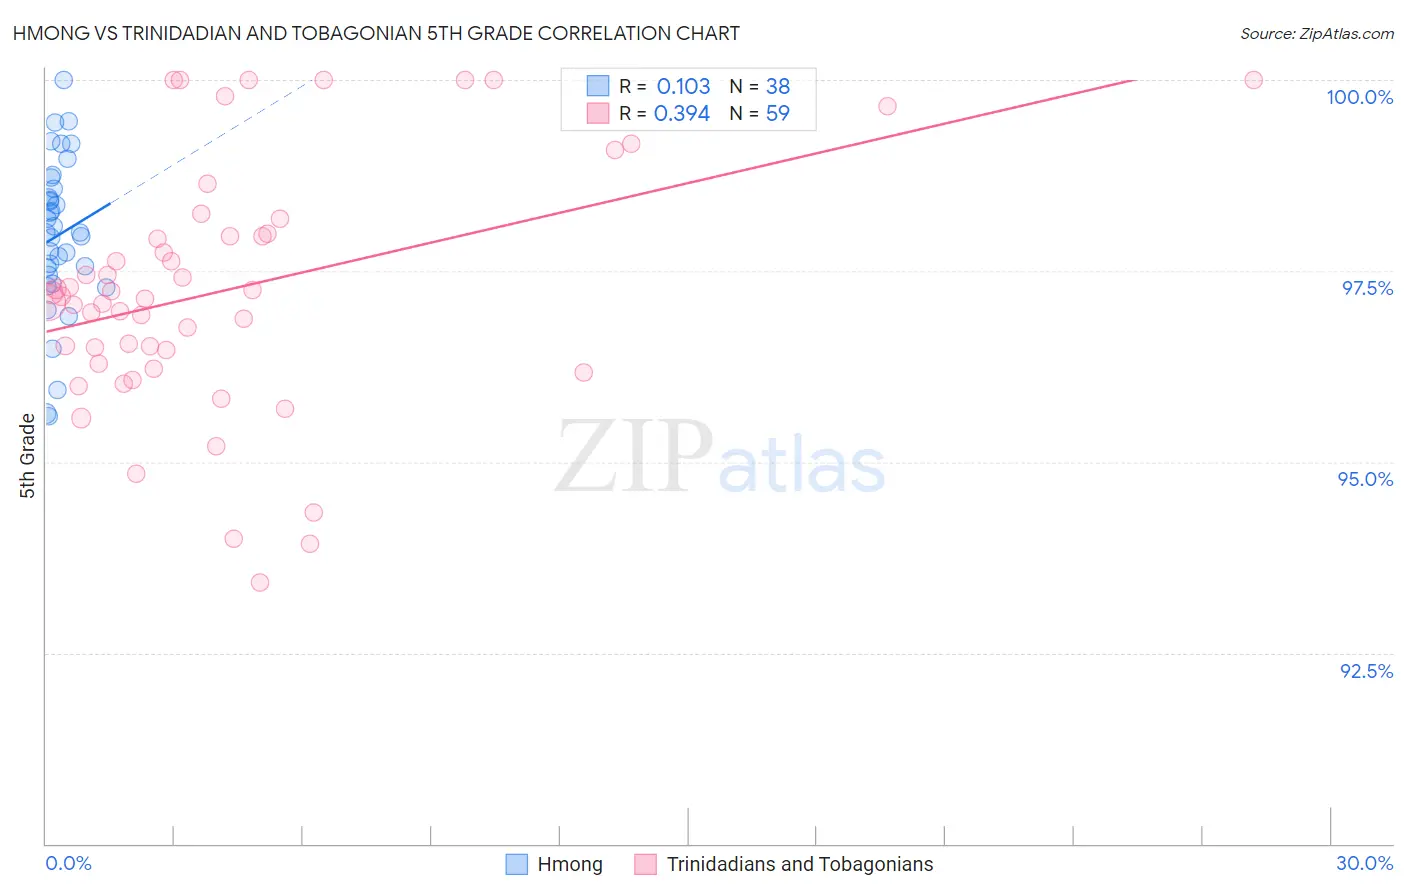
Hmong vs Trinidadian and Tobagonian 5th Grade Correlation Chart
The statistical analysis conducted on geographies consisting of 24,672,093 people shows a poor positive correlation between the proportion of Hmong and percentage of population with at least 5th grade education in the United States with a correlation coefficient (R) of 0.103 and weighted average of 97.6%. Similarly, the statistical analysis conducted on geographies consisting of 219,882,819 people shows a mild positive correlation between the proportion of Trinidadians and Tobagonians and percentage of population with at least 5th grade education in the United States with a correlation coefficient (R) of 0.394 and weighted average of 96.7%, a difference of 0.95%.
5th Grade Correlation Summary
| Measurement | Hmong | Trinidadian and Tobagonian |
| Minimum | 95.6% | 93.4% |
| Maximum | 100.0% | 100.0% |
| Range | 4.4% | 6.6% |
| Mean | 98.0% | 97.3% |
| Median | 98.0% | 97.2% |
| Interquartile 25% (IQ1) | 97.5% | 96.3% |
| Interquartile 75% (IQ3) | 98.6% | 98.0% |
| Interquartile Range (IQR) | 1.1% | 1.7% |
| Standard Deviation (Sample) | 1.0% | 1.6% |
| Standard Deviation (Population) | 1.0% | 1.6% |
Similar Demographics by 5th Grade
Demographics Similar to Hmong by 5th Grade
In terms of 5th grade, the demographic groups most similar to Hmong are Immigrants from Serbia (97.6%, a difference of 0.0%), Colville (97.6%, a difference of 0.0%), Immigrants from Bulgaria (97.6%, a difference of 0.010%), Immigrants from Europe (97.6%, a difference of 0.010%), and Immigrants from Romania (97.6%, a difference of 0.010%).
| Demographics | Rating | Rank | 5th Grade |
| Syrians | 95.1 /100 | #119 | Exceptional 97.6% |
| Immigrants | Zimbabwe | 94.9 /100 | #120 | Exceptional 97.6% |
| Immigrants | France | 94.8 /100 | #121 | Exceptional 97.6% |
| Immigrants | Japan | 94.7 /100 | #122 | Exceptional 97.6% |
| Immigrants | Norway | 94.6 /100 | #123 | Exceptional 97.6% |
| Spanish | 93.7 /100 | #124 | Exceptional 97.6% |
| Immigrants | Bulgaria | 93.1 /100 | #125 | Exceptional 97.6% |
| Hmong | 92.3 /100 | #126 | Exceptional 97.6% |
| Immigrants | Serbia | 92.3 /100 | #127 | Exceptional 97.6% |
| Colville | 92.0 /100 | #128 | Exceptional 97.6% |
| Immigrants | Europe | 91.9 /100 | #129 | Exceptional 97.6% |
| Immigrants | Romania | 91.6 /100 | #130 | Exceptional 97.6% |
| Pima | 91.2 /100 | #131 | Exceptional 97.6% |
| Immigrants | Kuwait | 90.4 /100 | #132 | Exceptional 97.6% |
| Cambodians | 90.2 /100 | #133 | Exceptional 97.6% |
Demographics Similar to Trinidadians and Tobagonians by 5th Grade
In terms of 5th grade, the demographic groups most similar to Trinidadians and Tobagonians are Immigrants from Hong Kong (96.7%, a difference of 0.010%), Yaqui (96.7%, a difference of 0.010%), Immigrants from Cameroon (96.7%, a difference of 0.010%), Afghan (96.7%, a difference of 0.020%), and Immigrants from Peru (96.6%, a difference of 0.020%).
| Demographics | Rating | Rank | 5th Grade |
| Taiwanese | 0.3 /100 | #265 | Tragic 96.7% |
| Immigrants | Nigeria | 0.3 /100 | #266 | Tragic 96.7% |
| Immigrants | South America | 0.3 /100 | #267 | Tragic 96.7% |
| Armenians | 0.3 /100 | #268 | Tragic 96.7% |
| Ghanaians | 0.2 /100 | #269 | Tragic 96.7% |
| Afghans | 0.2 /100 | #270 | Tragic 96.7% |
| Immigrants | Hong Kong | 0.2 /100 | #271 | Tragic 96.7% |
| Trinidadians and Tobagonians | 0.1 /100 | #272 | Tragic 96.7% |
| Yaqui | 0.1 /100 | #273 | Tragic 96.7% |
| Immigrants | Cameroon | 0.1 /100 | #274 | Tragic 96.7% |
| Immigrants | Peru | 0.1 /100 | #275 | Tragic 96.6% |
| Cubans | 0.1 /100 | #276 | Tragic 96.6% |
| Immigrants | Bolivia | 0.1 /100 | #277 | Tragic 96.6% |
| Immigrants | Ghana | 0.1 /100 | #278 | Tragic 96.6% |
| Immigrants | Philippines | 0.1 /100 | #279 | Tragic 96.6% |