Ethiopian vs Irish 12th Grade, No Diploma
COMPARE
Ethiopian
Irish
12th Grade, No Diploma
12th Grade, No Diploma Comparison
Ethiopians
Irish
91.0%
12TH GRADE, NO DIPLOMA
33.9/ 100
METRIC RATING
186th/ 347
METRIC RANK
93.0%
12TH GRADE, NO DIPLOMA
99.9/ 100
METRIC RATING
37th/ 347
METRIC RANK
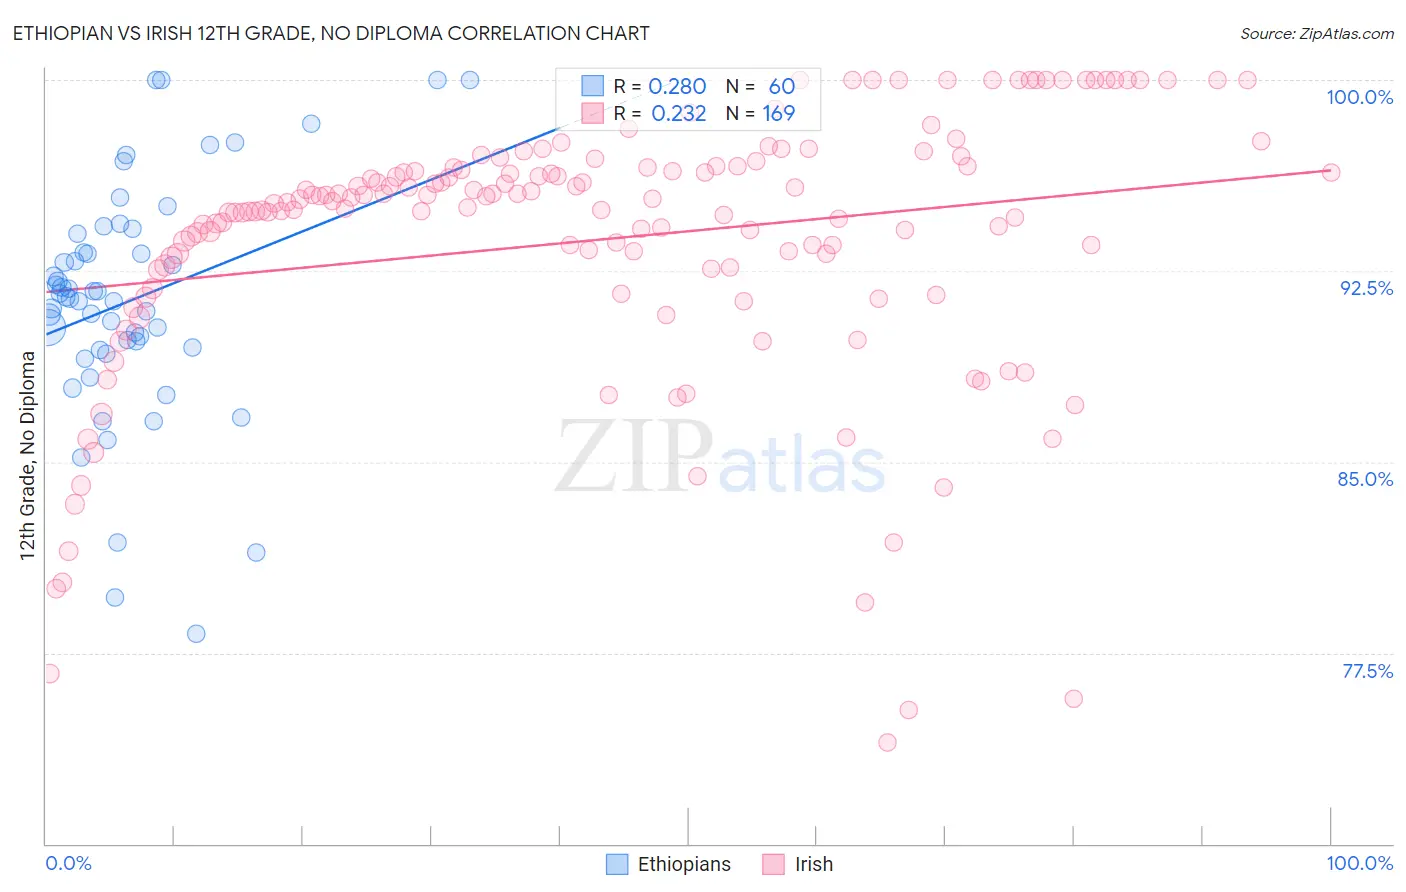
Ethiopian vs Irish 12th Grade, No Diploma Correlation Chart
The statistical analysis conducted on geographies consisting of 223,161,778 people shows a weak positive correlation between the proportion of Ethiopians and percentage of population with at least 12th grade (no diploma) education in the United States with a correlation coefficient (R) of 0.280 and weighted average of 91.0%. Similarly, the statistical analysis conducted on geographies consisting of 580,710,123 people shows a weak positive correlation between the proportion of Irish and percentage of population with at least 12th grade (no diploma) education in the United States with a correlation coefficient (R) of 0.232 and weighted average of 93.0%, a difference of 2.2%.
12th Grade, No Diploma Correlation Summary
| Measurement | Ethiopian | Irish |
| Minimum | 78.2% | 74.0% |
| Maximum | 100.0% | 100.0% |
| Range | 21.8% | 26.0% |
| Mean | 91.3% | 93.7% |
| Median | 91.4% | 95.1% |
| Interquartile 25% (IQ1) | 89.4% | 92.6% |
| Interquartile 75% (IQ3) | 93.6% | 96.6% |
| Interquartile Range (IQR) | 4.1% | 4.0% |
| Standard Deviation (Sample) | 4.6% | 5.3% |
| Standard Deviation (Population) | 4.6% | 5.2% |
Similar Demographics by 12th Grade, No Diploma
Demographics Similar to Ethiopians by 12th Grade, No Diploma
In terms of 12th grade, no diploma, the demographic groups most similar to Ethiopians are Sudanese (91.0%, a difference of 0.010%), Potawatomi (91.0%, a difference of 0.010%), American (91.0%, a difference of 0.020%), Spaniard (91.0%, a difference of 0.030%), and Immigrants from Uganda (90.9%, a difference of 0.030%).
| Demographics | Rating | Rank | 12th Grade, No Diploma |
| Immigrants | Chile | 43.3 /100 | #179 | Average 91.1% |
| Immigrants | Syria | 40.3 /100 | #180 | Average 91.1% |
| Guamanians/Chamorros | 39.5 /100 | #181 | Fair 91.0% |
| Immigrants | Nonimmigrants | 38.8 /100 | #182 | Fair 91.0% |
| Osage | 38.3 /100 | #183 | Fair 91.0% |
| Spaniards | 36.2 /100 | #184 | Fair 91.0% |
| Sudanese | 34.4 /100 | #185 | Fair 91.0% |
| Ethiopians | 33.9 /100 | #186 | Fair 91.0% |
| Potawatomi | 32.9 /100 | #187 | Fair 91.0% |
| Americans | 32.6 /100 | #188 | Fair 91.0% |
| Immigrants | Uganda | 31.6 /100 | #189 | Fair 90.9% |
| Afghans | 29.9 /100 | #190 | Fair 90.9% |
| Moroccans | 28.8 /100 | #191 | Fair 90.9% |
| Immigrants | Eastern Africa | 27.7 /100 | #192 | Fair 90.9% |
| Immigrants | Ethiopia | 27.2 /100 | #193 | Fair 90.9% |
Demographics Similar to Irish by 12th Grade, No Diploma
In terms of 12th grade, no diploma, the demographic groups most similar to Irish are Scottish (93.0%, a difference of 0.0%), Okinawan (93.0%, a difference of 0.010%), English (93.0%, a difference of 0.010%), Immigrants from Scotland (93.0%, a difference of 0.030%), and Tlingit-Haida (93.0%, a difference of 0.030%).
| Demographics | Rating | Rank | 12th Grade, No Diploma |
| Immigrants | Lithuania | 99.9 /100 | #30 | Exceptional 93.1% |
| Immigrants | Ireland | 99.9 /100 | #31 | Exceptional 93.1% |
| Europeans | 99.9 /100 | #32 | Exceptional 93.1% |
| Immigrants | Scotland | 99.9 /100 | #33 | Exceptional 93.0% |
| Okinawans | 99.9 /100 | #34 | Exceptional 93.0% |
| English | 99.9 /100 | #35 | Exceptional 93.0% |
| Scottish | 99.9 /100 | #36 | Exceptional 93.0% |
| Irish | 99.9 /100 | #37 | Exceptional 93.0% |
| Tlingit-Haida | 99.8 /100 | #38 | Exceptional 93.0% |
| Immigrants | Austria | 99.8 /100 | #39 | Exceptional 93.0% |
| Turks | 99.8 /100 | #40 | Exceptional 93.0% |
| Bhutanese | 99.8 /100 | #41 | Exceptional 93.0% |
| Immigrants | Australia | 99.8 /100 | #42 | Exceptional 92.9% |
| Northern Europeans | 99.8 /100 | #43 | Exceptional 92.9% |
| Dutch | 99.8 /100 | #44 | Exceptional 92.9% |