Ethiopian vs French American Indian 12th Grade, No Diploma
COMPARE
Ethiopian
French American Indian
12th Grade, No Diploma
12th Grade, No Diploma Comparison
Ethiopians
French American Indians
91.0%
12TH GRADE, NO DIPLOMA
33.9/ 100
METRIC RATING
186th/ 347
METRIC RANK
90.7%
12TH GRADE, NO DIPLOMA
15.5/ 100
METRIC RATING
204th/ 347
METRIC RANK
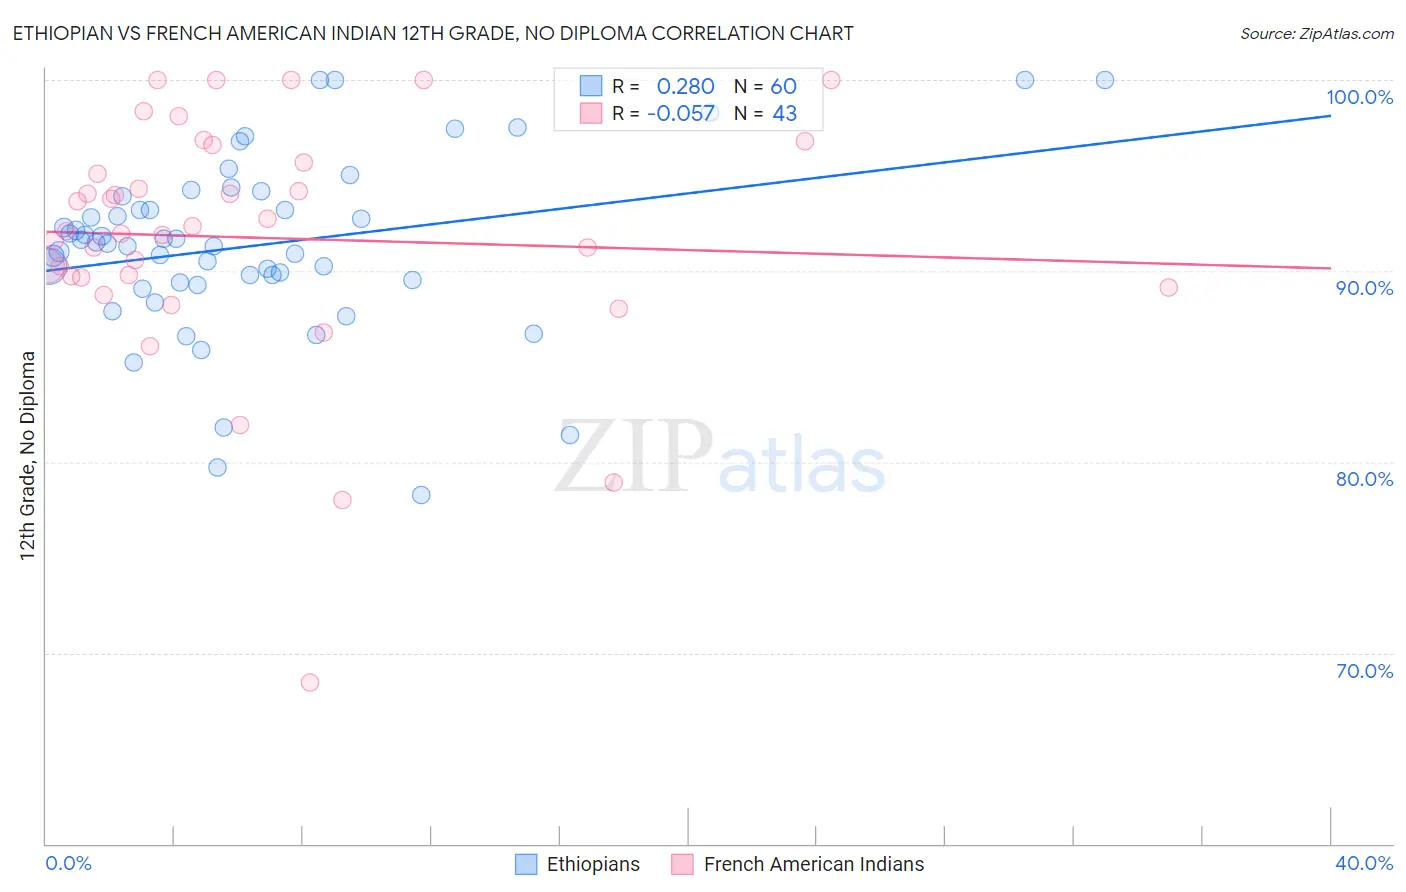
Ethiopian vs French American Indian 12th Grade, No Diploma Correlation Chart
The statistical analysis conducted on geographies consisting of 223,161,778 people shows a weak positive correlation between the proportion of Ethiopians and percentage of population with at least 12th grade (no diploma) education in the United States with a correlation coefficient (R) of 0.280 and weighted average of 91.0%. Similarly, the statistical analysis conducted on geographies consisting of 131,976,269 people shows a slight negative correlation between the proportion of French American Indians and percentage of population with at least 12th grade (no diploma) education in the United States with a correlation coefficient (R) of -0.057 and weighted average of 90.7%, a difference of 0.32%.
12th Grade, No Diploma Correlation Summary
| Measurement | Ethiopian | French American Indian |
| Minimum | 78.2% | 68.5% |
| Maximum | 100.0% | 100.0% |
| Range | 21.8% | 31.5% |
| Mean | 91.3% | 91.7% |
| Median | 91.4% | 92.1% |
| Interquartile 25% (IQ1) | 89.4% | 89.7% |
| Interquartile 75% (IQ3) | 93.6% | 95.7% |
| Interquartile Range (IQR) | 4.1% | 6.0% |
| Standard Deviation (Sample) | 4.6% | 6.3% |
| Standard Deviation (Population) | 4.6% | 6.2% |
Demographics Similar to Ethiopians and French American Indians by 12th Grade, No Diploma
In terms of 12th grade, no diploma, the demographic groups most similar to Ethiopians are Sudanese (91.0%, a difference of 0.010%), Potawatomi (91.0%, a difference of 0.010%), American (91.0%, a difference of 0.020%), Immigrants from Uganda (90.9%, a difference of 0.030%), and Afghan (90.9%, a difference of 0.060%). Similarly, the demographic groups most similar to French American Indians are Tongan (90.7%, a difference of 0.010%), Immigrants from Sierra Leone (90.7%, a difference of 0.010%), Marshallese (90.7%, a difference of 0.060%), Immigrants from Southern Europe (90.8%, a difference of 0.090%), and Liberian (90.8%, a difference of 0.090%).
| Demographics | Rating | Rank | 12th Grade, No Diploma |
| Sudanese | 34.4 /100 | #185 | Fair 91.0% |
| Ethiopians | 33.9 /100 | #186 | Fair 91.0% |
| Potawatomi | 32.9 /100 | #187 | Fair 91.0% |
| Americans | 32.6 /100 | #188 | Fair 91.0% |
| Immigrants | Uganda | 31.6 /100 | #189 | Fair 90.9% |
| Afghans | 29.9 /100 | #190 | Fair 90.9% |
| Moroccans | 28.8 /100 | #191 | Fair 90.9% |
| Immigrants | Eastern Africa | 27.7 /100 | #192 | Fair 90.9% |
| Immigrants | Ethiopia | 27.2 /100 | #193 | Fair 90.9% |
| Immigrants | Oceania | 26.0 /100 | #194 | Fair 90.9% |
| Koreans | 24.5 /100 | #195 | Fair 90.8% |
| Panamanians | 22.8 /100 | #196 | Fair 90.8% |
| Immigrants | Sudan | 22.6 /100 | #197 | Fair 90.8% |
| Samoans | 20.4 /100 | #198 | Fair 90.8% |
| Immigrants | Southern Europe | 19.9 /100 | #199 | Poor 90.8% |
| Liberians | 19.8 /100 | #200 | Poor 90.8% |
| Hawaiians | 19.7 /100 | #201 | Poor 90.8% |
| Marshallese | 18.2 /100 | #202 | Poor 90.7% |
| Tongans | 16.1 /100 | #203 | Poor 90.7% |
| French American Indians | 15.5 /100 | #204 | Poor 90.7% |
| Immigrants | Sierra Leone | 14.9 /100 | #205 | Poor 90.7% |