Immigrants from Armenia vs Navajo 12th Grade, No Diploma
COMPARE
Immigrants from Armenia
Navajo
12th Grade, No Diploma
12th Grade, No Diploma Comparison
Immigrants from Armenia
Navajo
87.6%
12TH GRADE, NO DIPLOMA
0.0/ 100
METRIC RATING
309th/ 347
METRIC RANK
87.1%
12TH GRADE, NO DIPLOMA
0.0/ 100
METRIC RATING
317th/ 347
METRIC RANK
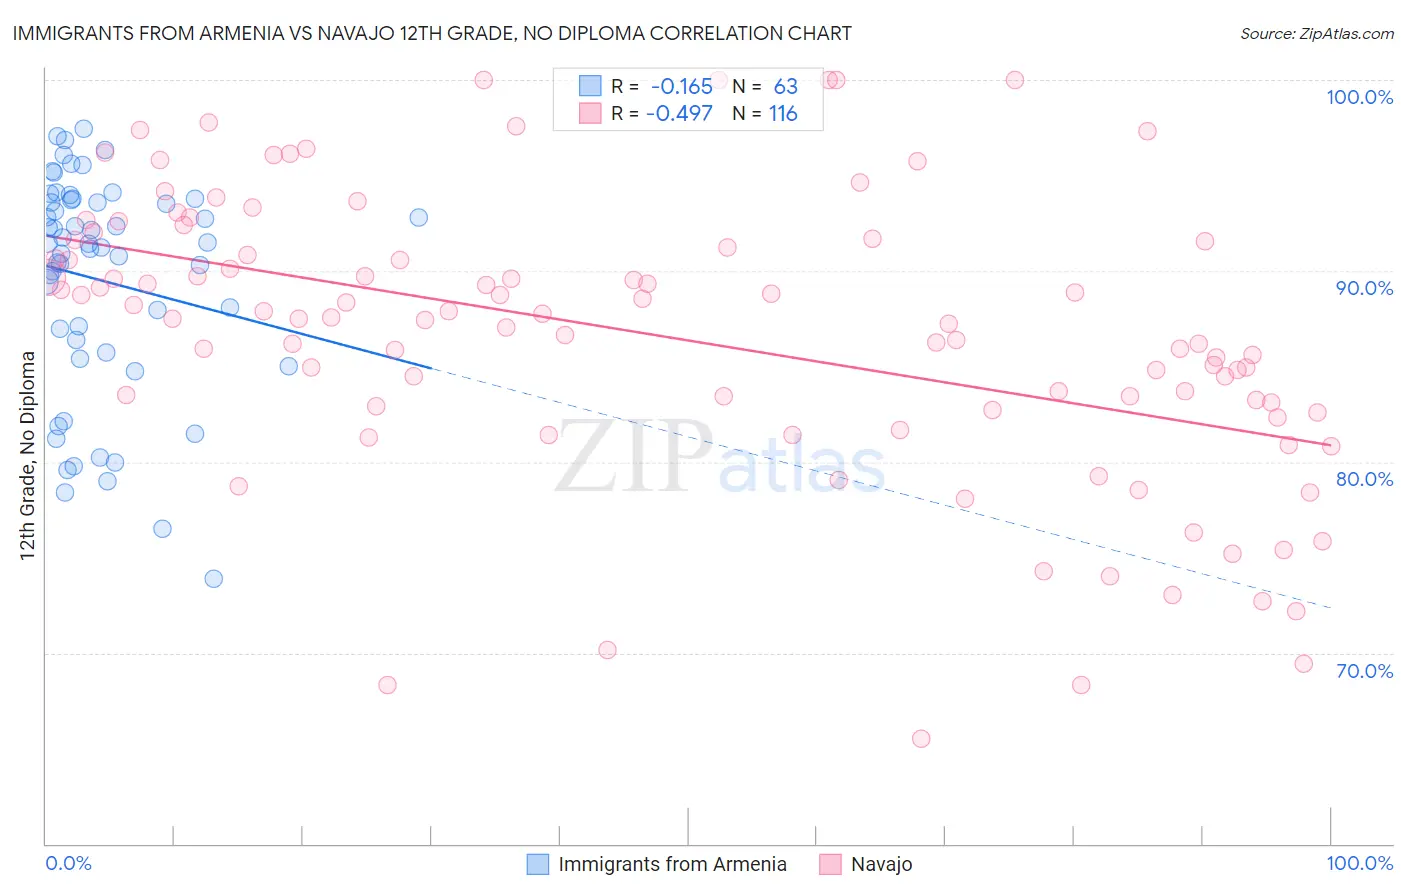
Immigrants from Armenia vs Navajo 12th Grade, No Diploma Correlation Chart
The statistical analysis conducted on geographies consisting of 97,657,339 people shows a poor negative correlation between the proportion of Immigrants from Armenia and percentage of population with at least 12th grade (no diploma) education in the United States with a correlation coefficient (R) of -0.165 and weighted average of 87.6%. Similarly, the statistical analysis conducted on geographies consisting of 224,872,856 people shows a moderate negative correlation between the proportion of Navajo and percentage of population with at least 12th grade (no diploma) education in the United States with a correlation coefficient (R) of -0.497 and weighted average of 87.1%, a difference of 0.56%.
12th Grade, No Diploma Correlation Summary
| Measurement | Immigrants from Armenia | Navajo |
| Minimum | 73.9% | 65.5% |
| Maximum | 97.4% | 100.0% |
| Range | 23.5% | 34.5% |
| Mean | 89.5% | 86.6% |
| Median | 91.4% | 87.5% |
| Interquartile 25% (IQ1) | 85.7% | 82.8% |
| Interquartile 75% (IQ3) | 93.7% | 91.4% |
| Interquartile Range (IQR) | 8.0% | 8.6% |
| Standard Deviation (Sample) | 5.8% | 7.5% |
| Standard Deviation (Population) | 5.7% | 7.5% |
Demographics Similar to Immigrants from Armenia and Navajo by 12th Grade, No Diploma
In terms of 12th grade, no diploma, the demographic groups most similar to Immigrants from Armenia are Yup'ik (87.6%, a difference of 0.030%), Immigrants from Cuba (87.5%, a difference of 0.050%), Immigrants from Portugal (87.6%, a difference of 0.070%), Yaqui (87.5%, a difference of 0.090%), and Immigrants from Ecuador (87.5%, a difference of 0.10%). Similarly, the demographic groups most similar to Navajo are Belizean (87.0%, a difference of 0.060%), Immigrants from Belize (87.0%, a difference of 0.14%), Apache (87.3%, a difference of 0.28%), Nicaraguan (87.3%, a difference of 0.30%), and Cape Verdean (87.4%, a difference of 0.33%).
| Demographics | Rating | Rank | 12th Grade, No Diploma |
| Immigrants | Bangladesh | 0.0 /100 | #303 | Tragic 88.0% |
| Vietnamese | 0.0 /100 | #304 | Tragic 87.9% |
| Immigrants | Dominica | 0.0 /100 | #305 | Tragic 87.7% |
| Natives/Alaskans | 0.0 /100 | #306 | Tragic 87.7% |
| Immigrants | Portugal | 0.0 /100 | #307 | Tragic 87.6% |
| Yup'ik | 0.0 /100 | #308 | Tragic 87.6% |
| Immigrants | Armenia | 0.0 /100 | #309 | Tragic 87.6% |
| Immigrants | Cuba | 0.0 /100 | #310 | Tragic 87.5% |
| Yaqui | 0.0 /100 | #311 | Tragic 87.5% |
| Immigrants | Ecuador | 0.0 /100 | #312 | Tragic 87.5% |
| Immigrants | Caribbean | 0.0 /100 | #313 | Tragic 87.4% |
| Cape Verdeans | 0.0 /100 | #314 | Tragic 87.4% |
| Nicaraguans | 0.0 /100 | #315 | Tragic 87.3% |
| Apache | 0.0 /100 | #316 | Tragic 87.3% |
| Navajo | 0.0 /100 | #317 | Tragic 87.1% |
| Belizeans | 0.0 /100 | #318 | Tragic 87.0% |
| Immigrants | Belize | 0.0 /100 | #319 | Tragic 87.0% |
| Immigrants | Nicaragua | 0.0 /100 | #320 | Tragic 86.6% |
| Puerto Ricans | 0.0 /100 | #321 | Tragic 86.5% |
| Central American Indians | 0.0 /100 | #322 | Tragic 86.5% |
| Yuman | 0.0 /100 | #323 | Tragic 86.5% |