Ethiopian vs Immigrants from Europe Unemployment Among Seniors over 75 years
COMPARE
Ethiopian
Immigrants from Europe
Unemployment Among Seniors over 75 years
Unemployment Among Seniors over 75 years Comparison
Ethiopians
Immigrants from Europe
8.6%
UNEMPLOYMENT AMONG SENIORS OVER 75 YEARS
75.3/ 100
METRIC RATING
158th/ 347
METRIC RANK
8.8%
UNEMPLOYMENT AMONG SENIORS OVER 75 YEARS
35.2/ 100
METRIC RATING
187th/ 347
METRIC RANK
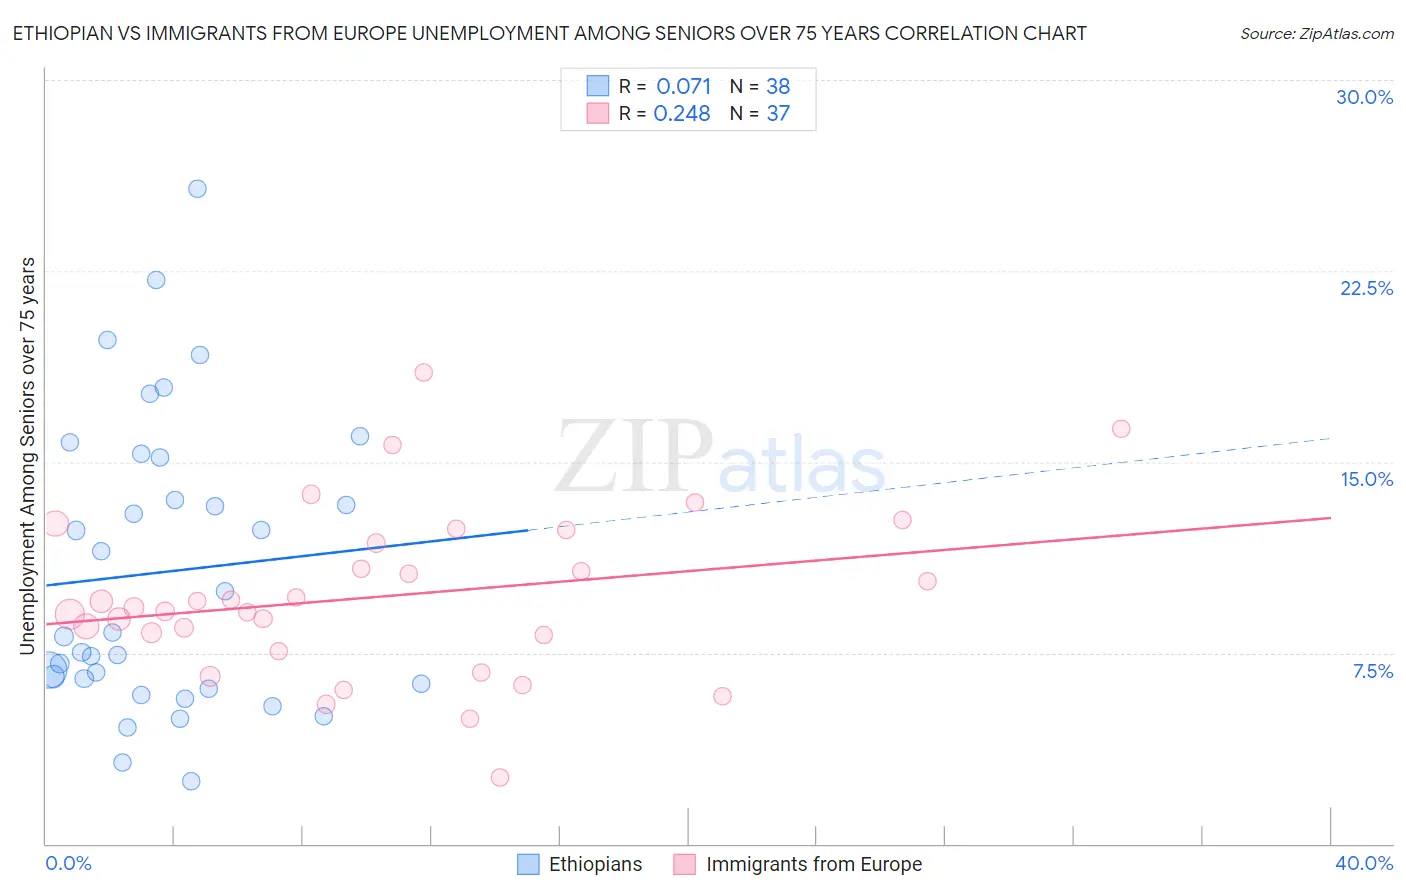
Ethiopian vs Immigrants from Europe Unemployment Among Seniors over 75 years Correlation Chart
The statistical analysis conducted on geographies consisting of 138,125,382 people shows a slight positive correlation between the proportion of Ethiopians and unemployment rate among seniors over the age of 75 in the United States with a correlation coefficient (R) of 0.071 and weighted average of 8.6%. Similarly, the statistical analysis conducted on geographies consisting of 233,232,090 people shows a weak positive correlation between the proportion of Immigrants from Europe and unemployment rate among seniors over the age of 75 in the United States with a correlation coefficient (R) of 0.248 and weighted average of 8.8%, a difference of 2.3%.
Unemployment Among Seniors over 75 years Correlation Summary
| Measurement | Ethiopian | Immigrants from Europe |
| Minimum | 2.5% | 2.6% |
| Maximum | 25.7% | 18.5% |
| Range | 23.3% | 15.9% |
| Mean | 10.7% | 9.7% |
| Median | 8.2% | 9.3% |
| Interquartile 25% (IQ1) | 6.3% | 7.9% |
| Interquartile 75% (IQ3) | 15.2% | 12.1% |
| Interquartile Range (IQR) | 8.9% | 4.2% |
| Standard Deviation (Sample) | 5.7% | 3.3% |
| Standard Deviation (Population) | 5.6% | 3.3% |
Similar Demographics by Unemployment Among Seniors over 75 years
Demographics Similar to Ethiopians by Unemployment Among Seniors over 75 years
In terms of unemployment among seniors over 75 years, the demographic groups most similar to Ethiopians are Shoshone (8.6%, a difference of 0.050%), Turkish (8.6%, a difference of 0.080%), Immigrants from Bahamas (8.6%, a difference of 0.090%), Cree (8.6%, a difference of 0.17%), and Albanian (8.6%, a difference of 0.17%).
| Demographics | Rating | Rank | Unemployment Among Seniors over 75 years |
| Immigrants | Bosnia and Herzegovina | 80.6 /100 | #151 | Excellent 8.6% |
| Latvians | 80.5 /100 | #152 | Excellent 8.6% |
| Mongolians | 80.1 /100 | #153 | Excellent 8.6% |
| Immigrants | Pakistan | 79.7 /100 | #154 | Good 8.6% |
| Ecuadorians | 78.5 /100 | #155 | Good 8.6% |
| Immigrants | Bahamas | 76.5 /100 | #156 | Good 8.6% |
| Turks | 76.4 /100 | #157 | Good 8.6% |
| Ethiopians | 75.3 /100 | #158 | Good 8.6% |
| Shoshone | 74.6 /100 | #159 | Good 8.6% |
| Cree | 72.8 /100 | #160 | Good 8.6% |
| Albanians | 72.8 /100 | #161 | Good 8.6% |
| Immigrants | South America | 71.3 /100 | #162 | Good 8.6% |
| Immigrants | Guatemala | 68.4 /100 | #163 | Good 8.7% |
| Paraguayans | 62.2 /100 | #164 | Good 8.7% |
| Immigrants | Dominican Republic | 61.4 /100 | #165 | Good 8.7% |
Demographics Similar to Immigrants from Europe by Unemployment Among Seniors over 75 years
In terms of unemployment among seniors over 75 years, the demographic groups most similar to Immigrants from Europe are Immigrants from Eastern Europe (8.8%, a difference of 0.030%), Immigrants from Haiti (8.8%, a difference of 0.030%), Mexican American Indian (8.8%, a difference of 0.030%), Immigrants from Ethiopia (8.8%, a difference of 0.050%), and Immigrants from Micronesia (8.8%, a difference of 0.11%).
| Demographics | Rating | Rank | Unemployment Among Seniors over 75 years |
| Immigrants | Somalia | 41.7 /100 | #180 | Average 8.8% |
| Immigrants | Thailand | 40.2 /100 | #181 | Average 8.8% |
| Guatemalans | 39.5 /100 | #182 | Fair 8.8% |
| Immigrants | Afghanistan | 38.2 /100 | #183 | Fair 8.8% |
| Immigrants | Micronesia | 37.2 /100 | #184 | Fair 8.8% |
| Choctaw | 37.1 /100 | #185 | Fair 8.8% |
| Immigrants | Ethiopia | 36.2 /100 | #186 | Fair 8.8% |
| Immigrants | Europe | 35.2 /100 | #187 | Fair 8.8% |
| Immigrants | Eastern Europe | 34.7 /100 | #188 | Fair 8.8% |
| Immigrants | Haiti | 34.7 /100 | #189 | Fair 8.8% |
| Mexican American Indians | 34.7 /100 | #190 | Fair 8.8% |
| Estonians | 33.3 /100 | #191 | Fair 8.8% |
| Immigrants | Kenya | 31.8 /100 | #192 | Fair 8.8% |
| Immigrants | Guyana | 29.9 /100 | #193 | Fair 8.8% |
| Maltese | 29.2 /100 | #194 | Fair 8.8% |