Estonian vs Immigrants from Nicaragua No Schooling Completed
COMPARE
Estonian
Immigrants from Nicaragua
No Schooling Completed
No Schooling Completed Comparison
Estonians
Immigrants from Nicaragua
1.6%
NO SCHOOLING COMPLETED
99.9/ 100
METRIC RATING
44th/ 347
METRIC RANK
3.1%
NO SCHOOLING COMPLETED
0.0/ 100
METRIC RATING
315th/ 347
METRIC RANK
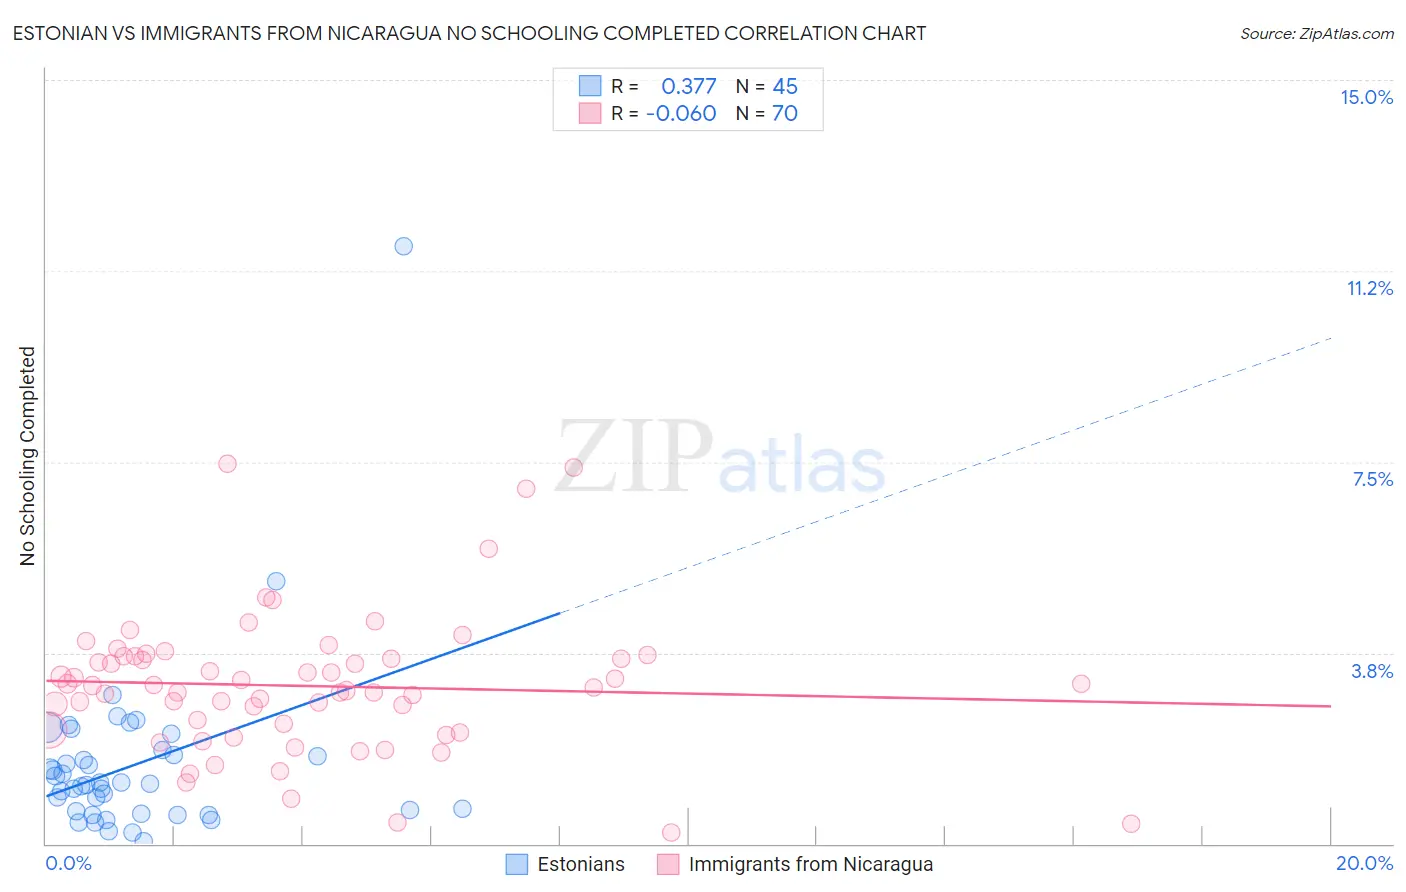
Estonian vs Immigrants from Nicaragua No Schooling Completed Correlation Chart
The statistical analysis conducted on geographies consisting of 123,023,374 people shows a mild positive correlation between the proportion of Estonians and percentage of population with no schooling in the United States with a correlation coefficient (R) of 0.377 and weighted average of 1.6%. Similarly, the statistical analysis conducted on geographies consisting of 235,758,389 people shows a slight negative correlation between the proportion of Immigrants from Nicaragua and percentage of population with no schooling in the United States with a correlation coefficient (R) of -0.060 and weighted average of 3.1%, a difference of 89.7%.
No Schooling Completed Correlation Summary
| Measurement | Estonian | Immigrants from Nicaragua |
| Minimum | 0.039% | 0.23% |
| Maximum | 11.7% | 7.5% |
| Range | 11.7% | 7.2% |
| Mean | 1.6% | 3.1% |
| Median | 1.2% | 3.1% |
| Interquartile 25% (IQ1) | 0.62% | 2.2% |
| Interquartile 75% (IQ3) | 1.8% | 3.7% |
| Interquartile Range (IQR) | 1.2% | 1.4% |
| Standard Deviation (Sample) | 1.8% | 1.4% |
| Standard Deviation (Population) | 1.8% | 1.4% |
Similar Demographics by No Schooling Completed
Demographics Similar to Estonians by No Schooling Completed
In terms of no schooling completed, the demographic groups most similar to Estonians are Czechoslovakian (1.6%, a difference of 0.040%), Maltese (1.6%, a difference of 0.13%), Australian (1.6%, a difference of 0.19%), Ottawa (1.6%, a difference of 0.27%), and Bulgarian (1.6%, a difference of 0.31%).
| Demographics | Rating | Rank | No Schooling Completed |
| Belgians | 99.9 /100 | #37 | Exceptional 1.6% |
| Northern Europeans | 99.9 /100 | #38 | Exceptional 1.6% |
| Native Hawaiians | 99.9 /100 | #39 | Exceptional 1.6% |
| Luxembourgers | 99.9 /100 | #40 | Exceptional 1.6% |
| Hungarians | 99.9 /100 | #41 | Exceptional 1.6% |
| Bulgarians | 99.9 /100 | #42 | Exceptional 1.6% |
| Australians | 99.9 /100 | #43 | Exceptional 1.6% |
| Estonians | 99.9 /100 | #44 | Exceptional 1.6% |
| Czechoslovakians | 99.9 /100 | #45 | Exceptional 1.6% |
| Maltese | 99.9 /100 | #46 | Exceptional 1.6% |
| Ottawa | 99.9 /100 | #47 | Exceptional 1.6% |
| Immigrants | Scotland | 99.9 /100 | #48 | Exceptional 1.6% |
| Whites/Caucasians | 99.9 /100 | #49 | Exceptional 1.6% |
| Celtics | 99.9 /100 | #50 | Exceptional 1.6% |
| Chippewa | 99.8 /100 | #51 | Exceptional 1.6% |
Demographics Similar to Immigrants from Nicaragua by No Schooling Completed
In terms of no schooling completed, the demographic groups most similar to Immigrants from Nicaragua are Immigrants from Belize (3.1%, a difference of 0.24%), Honduran (3.1%, a difference of 0.33%), Immigrants from Ecuador (3.1%, a difference of 0.36%), Sri Lankan (3.0%, a difference of 0.84%), and Cape Verdean (3.1%, a difference of 0.84%).
| Demographics | Rating | Rank | No Schooling Completed |
| Immigrants | Somalia | 0.0 /100 | #308 | Tragic 3.0% |
| Hispanics or Latinos | 0.0 /100 | #309 | Tragic 3.0% |
| Guyanese | 0.0 /100 | #310 | Tragic 3.0% |
| Immigrants | Azores | 0.0 /100 | #311 | Tragic 3.0% |
| Sri Lankans | 0.0 /100 | #312 | Tragic 3.0% |
| Hondurans | 0.0 /100 | #313 | Tragic 3.1% |
| Immigrants | Belize | 0.0 /100 | #314 | Tragic 3.1% |
| Immigrants | Nicaragua | 0.0 /100 | #315 | Tragic 3.1% |
| Immigrants | Ecuador | 0.0 /100 | #316 | Tragic 3.1% |
| Cape Verdeans | 0.0 /100 | #317 | Tragic 3.1% |
| Immigrants | Guyana | 0.0 /100 | #318 | Tragic 3.1% |
| Immigrants | Burma/Myanmar | 0.0 /100 | #319 | Tragic 3.1% |
| Immigrants | Bangladesh | 0.0 /100 | #320 | Tragic 3.1% |
| Immigrants | Laos | 0.0 /100 | #321 | Tragic 3.1% |
| Immigrants | Honduras | 0.0 /100 | #322 | Tragic 3.2% |