Immigrants from Austria vs Immigrants from Cambodia 11th Grade
COMPARE
Immigrants from Austria
Immigrants from Cambodia
11th Grade
11th Grade Comparison
Immigrants from Austria
Immigrants from Cambodia
94.1%
11TH GRADE
99.9/ 100
METRIC RATING
42nd/ 347
METRIC RANK
89.6%
11TH GRADE
0.0/ 100
METRIC RATING
305th/ 347
METRIC RANK
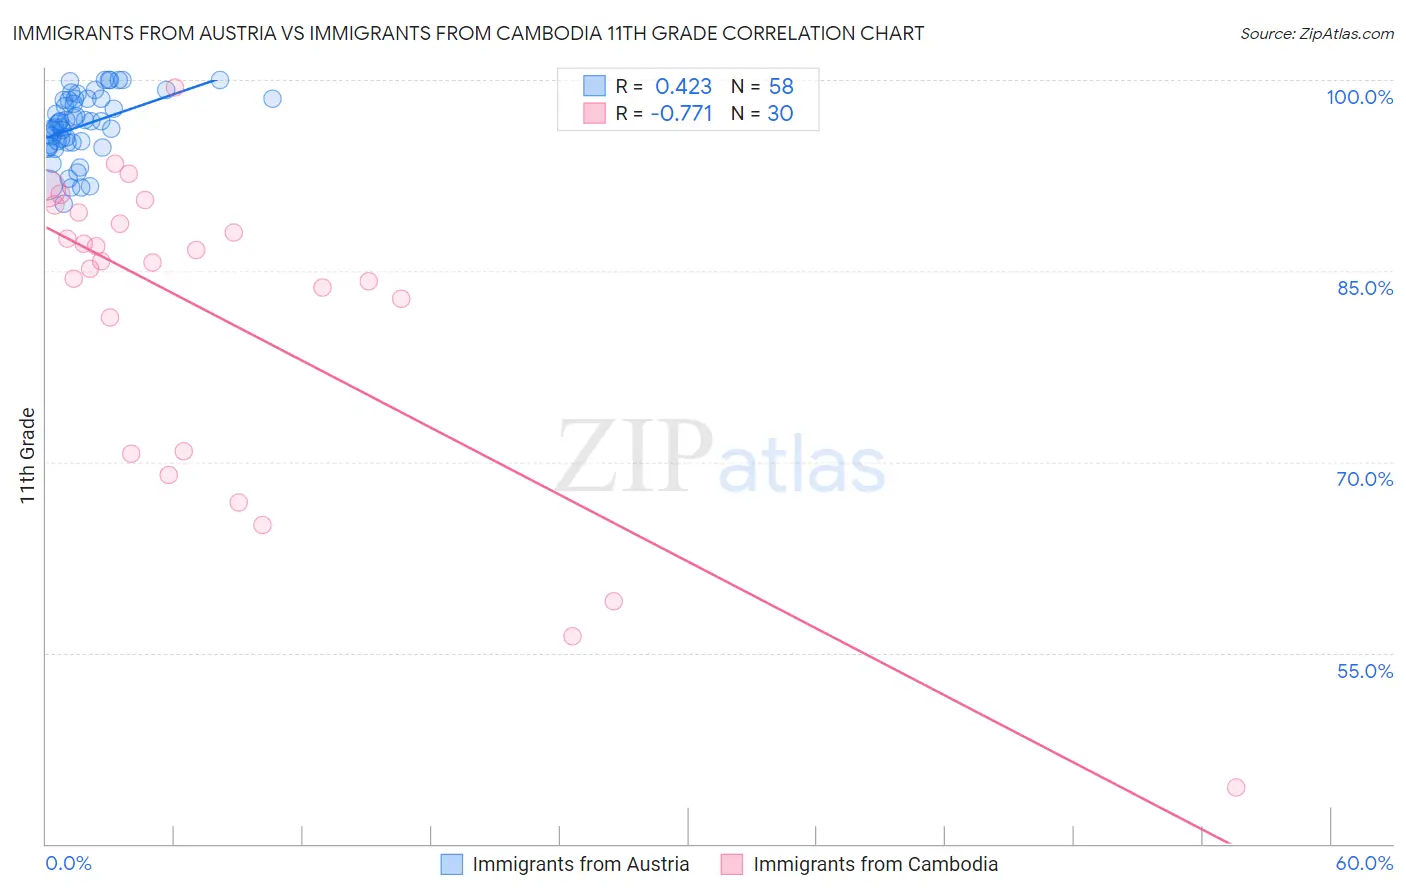
Immigrants from Austria vs Immigrants from Cambodia 11th Grade Correlation Chart
The statistical analysis conducted on geographies consisting of 167,973,618 people shows a moderate positive correlation between the proportion of Immigrants from Austria and percentage of population with at least 11th grade education in the United States with a correlation coefficient (R) of 0.423 and weighted average of 94.1%. Similarly, the statistical analysis conducted on geographies consisting of 205,153,442 people shows a strong negative correlation between the proportion of Immigrants from Cambodia and percentage of population with at least 11th grade education in the United States with a correlation coefficient (R) of -0.771 and weighted average of 89.6%, a difference of 5.0%.
11th Grade Correlation Summary
| Measurement | Immigrants from Austria | Immigrants from Cambodia |
| Minimum | 90.3% | 44.4% |
| Maximum | 100.0% | 99.4% |
| Range | 9.7% | 54.9% |
| Mean | 96.4% | 81.3% |
| Median | 96.6% | 85.7% |
| Interquartile 25% (IQ1) | 95.1% | 70.9% |
| Interquartile 75% (IQ3) | 98.5% | 89.6% |
| Interquartile Range (IQR) | 3.5% | 18.7% |
| Standard Deviation (Sample) | 2.5% | 12.7% |
| Standard Deviation (Population) | 2.5% | 12.5% |
Similar Demographics by 11th Grade
Demographics Similar to Immigrants from Austria by 11th Grade
In terms of 11th grade, the demographic groups most similar to Immigrants from Austria are Cypriot (94.1%, a difference of 0.010%), Greek (94.1%, a difference of 0.010%), Immigrants from Lithuania (94.1%, a difference of 0.020%), Thai (94.1%, a difference of 0.020%), and Immigrants from Ireland (94.1%, a difference of 0.020%).
| Demographics | Rating | Rank | 11th Grade |
| Immigrants | Singapore | 99.9 /100 | #35 | Exceptional 94.2% |
| Immigrants | Northern Europe | 99.9 /100 | #36 | Exceptional 94.2% |
| Northern Europeans | 99.9 /100 | #37 | Exceptional 94.2% |
| Hungarians | 99.9 /100 | #38 | Exceptional 94.2% |
| Immigrants | Lithuania | 99.9 /100 | #39 | Exceptional 94.1% |
| Thais | 99.9 /100 | #40 | Exceptional 94.1% |
| Cypriots | 99.9 /100 | #41 | Exceptional 94.1% |
| Immigrants | Austria | 99.9 /100 | #42 | Exceptional 94.1% |
| Greeks | 99.9 /100 | #43 | Exceptional 94.1% |
| Immigrants | Ireland | 99.9 /100 | #44 | Exceptional 94.1% |
| Australians | 99.9 /100 | #45 | Exceptional 94.1% |
| Serbians | 99.9 /100 | #46 | Exceptional 94.1% |
| Filipinos | 99.9 /100 | #47 | Exceptional 94.1% |
| Macedonians | 99.9 /100 | #48 | Exceptional 94.1% |
| Slavs | 99.9 /100 | #49 | Exceptional 94.1% |
Demographics Similar to Immigrants from Cambodia by 11th Grade
In terms of 11th grade, the demographic groups most similar to Immigrants from Cambodia are Ecuadorian (89.6%, a difference of 0.050%), Immigrants (89.7%, a difference of 0.080%), Yuman (89.7%, a difference of 0.080%), Immigrants from Guyana (89.7%, a difference of 0.090%), and Immigrants from Dominica (89.5%, a difference of 0.10%).
| Demographics | Rating | Rank | 11th Grade |
| Immigrants | Fiji | 0.0 /100 | #298 | Tragic 89.9% |
| Japanese | 0.0 /100 | #299 | Tragic 89.9% |
| Immigrants | Haiti | 0.0 /100 | #300 | Tragic 89.9% |
| Guyanese | 0.0 /100 | #301 | Tragic 89.9% |
| Immigrants | Guyana | 0.0 /100 | #302 | Tragic 89.7% |
| Immigrants | Immigrants | 0.0 /100 | #303 | Tragic 89.7% |
| Yuman | 0.0 /100 | #304 | Tragic 89.7% |
| Immigrants | Cambodia | 0.0 /100 | #305 | Tragic 89.6% |
| Ecuadorians | 0.0 /100 | #306 | Tragic 89.6% |
| Immigrants | Dominica | 0.0 /100 | #307 | Tragic 89.5% |
| Nepalese | 0.0 /100 | #308 | Tragic 89.5% |
| Immigrants | Bangladesh | 0.0 /100 | #309 | Tragic 89.5% |
| Yaqui | 0.0 /100 | #310 | Tragic 89.5% |
| Vietnamese | 0.0 /100 | #311 | Tragic 89.4% |
| Immigrants | Portugal | 0.0 /100 | #312 | Tragic 89.3% |