Estonian vs Immigrants from Czechoslovakia 11th Grade
COMPARE
Estonian
Immigrants from Czechoslovakia
11th Grade
11th Grade Comparison
Estonians
Immigrants from Czechoslovakia
94.4%
11TH GRADE
100.0/ 100
METRIC RATING
28th/ 347
METRIC RANK
93.8%
11TH GRADE
99.6/ 100
METRIC RATING
74th/ 347
METRIC RANK
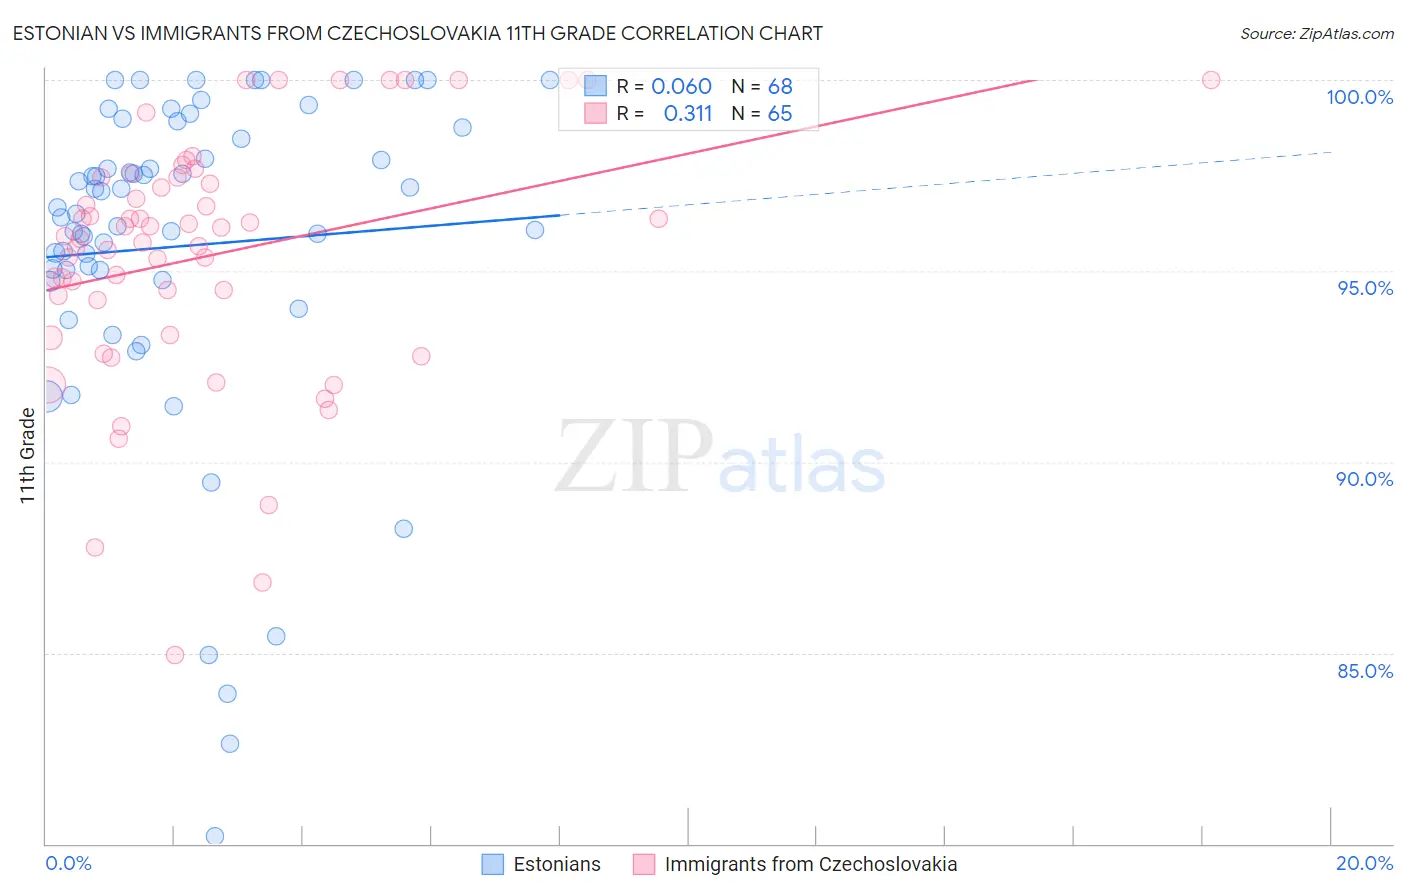
Estonian vs Immigrants from Czechoslovakia 11th Grade Correlation Chart
The statistical analysis conducted on geographies consisting of 123,528,404 people shows a slight positive correlation between the proportion of Estonians and percentage of population with at least 11th grade education in the United States with a correlation coefficient (R) of 0.060 and weighted average of 94.4%. Similarly, the statistical analysis conducted on geographies consisting of 195,448,106 people shows a mild positive correlation between the proportion of Immigrants from Czechoslovakia and percentage of population with at least 11th grade education in the United States with a correlation coefficient (R) of 0.311 and weighted average of 93.8%, a difference of 0.61%.
11th Grade Correlation Summary
| Measurement | Estonian | Immigrants from Czechoslovakia |
| Minimum | 80.2% | 84.9% |
| Maximum | 100.0% | 100.0% |
| Range | 19.8% | 15.1% |
| Mean | 95.6% | 95.4% |
| Median | 96.6% | 95.9% |
| Interquartile 25% (IQ1) | 94.9% | 93.8% |
| Interquartile 75% (IQ3) | 98.6% | 97.4% |
| Interquartile Range (IQR) | 3.7% | 3.7% |
| Standard Deviation (Sample) | 4.3% | 3.3% |
| Standard Deviation (Population) | 4.3% | 3.3% |
Similar Demographics by 11th Grade
Demographics Similar to Estonians by 11th Grade
In terms of 11th grade, the demographic groups most similar to Estonians are European (94.4%, a difference of 0.010%), Dutch (94.3%, a difference of 0.020%), Irish (94.4%, a difference of 0.030%), Scottish (94.4%, a difference of 0.030%), and English (94.4%, a difference of 0.050%).
| Demographics | Rating | Rank | 11th Grade |
| Tlingit-Haida | 100.0 /100 | #21 | Exceptional 94.4% |
| Tsimshian | 100.0 /100 | #22 | Exceptional 94.4% |
| Czechs | 100.0 /100 | #23 | Exceptional 94.4% |
| English | 100.0 /100 | #24 | Exceptional 94.4% |
| Irish | 100.0 /100 | #25 | Exceptional 94.4% |
| Scottish | 100.0 /100 | #26 | Exceptional 94.4% |
| Europeans | 100.0 /100 | #27 | Exceptional 94.4% |
| Estonians | 100.0 /100 | #28 | Exceptional 94.4% |
| Dutch | 100.0 /100 | #29 | Exceptional 94.3% |
| Russians | 100.0 /100 | #30 | Exceptional 94.3% |
| Welsh | 99.9 /100 | #31 | Exceptional 94.2% |
| Belgians | 99.9 /100 | #32 | Exceptional 94.2% |
| British | 99.9 /100 | #33 | Exceptional 94.2% |
| Immigrants | Scotland | 99.9 /100 | #34 | Exceptional 94.2% |
| Immigrants | Singapore | 99.9 /100 | #35 | Exceptional 94.2% |
Demographics Similar to Immigrants from Czechoslovakia by 11th Grade
In terms of 11th grade, the demographic groups most similar to Immigrants from Czechoslovakia are Romanian (93.8%, a difference of 0.0%), Immigrants from Japan (93.8%, a difference of 0.020%), Immigrants from Latvia (93.8%, a difference of 0.020%), Immigrants from South Africa (93.8%, a difference of 0.050%), and Celtic (93.7%, a difference of 0.050%).
| Demographics | Rating | Rank | 11th Grade |
| Immigrants | Netherlands | 99.8 /100 | #67 | Exceptional 93.9% |
| Zimbabweans | 99.8 /100 | #68 | Exceptional 93.9% |
| Scotch-Irish | 99.8 /100 | #69 | Exceptional 93.9% |
| Immigrants | England | 99.7 /100 | #70 | Exceptional 93.8% |
| Immigrants | South Africa | 99.7 /100 | #71 | Exceptional 93.8% |
| Immigrants | Japan | 99.7 /100 | #72 | Exceptional 93.8% |
| Romanians | 99.6 /100 | #73 | Exceptional 93.8% |
| Immigrants | Czechoslovakia | 99.6 /100 | #74 | Exceptional 93.8% |
| Immigrants | Latvia | 99.6 /100 | #75 | Exceptional 93.8% |
| Celtics | 99.5 /100 | #76 | Exceptional 93.7% |
| Aleuts | 99.5 /100 | #77 | Exceptional 93.7% |
| Soviet Union | 99.5 /100 | #78 | Exceptional 93.7% |
| Immigrants | Denmark | 99.5 /100 | #79 | Exceptional 93.7% |
| Canadians | 99.5 /100 | #80 | Exceptional 93.7% |
| Immigrants | Moldova | 99.5 /100 | #81 | Exceptional 93.7% |