Estonian vs Immigrants from Panama Professional Degree
COMPARE
Estonian
Immigrants from Panama
Professional Degree
Professional Degree Comparison
Estonians
Immigrants from Panama
6.0%
PROFESSIONAL DEGREE
100.0/ 100
METRIC RATING
42nd/ 347
METRIC RANK
4.1%
PROFESSIONAL DEGREE
12.3/ 100
METRIC RATING
209th/ 347
METRIC RANK
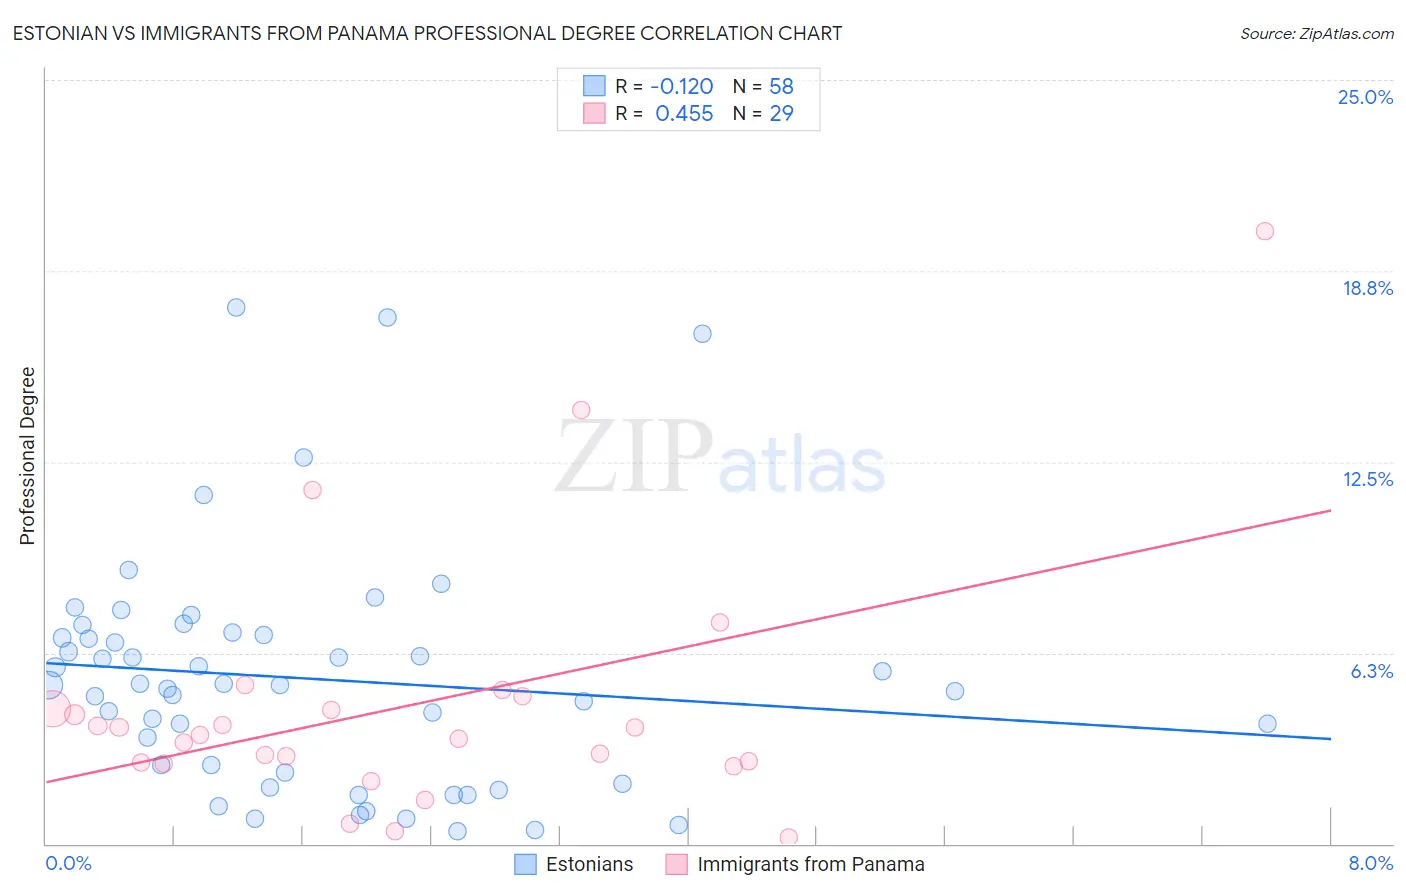
Estonian vs Immigrants from Panama Professional Degree Correlation Chart
The statistical analysis conducted on geographies consisting of 123,468,720 people shows a poor negative correlation between the proportion of Estonians and percentage of population with at least professional degree education in the United States with a correlation coefficient (R) of -0.120 and weighted average of 6.0%. Similarly, the statistical analysis conducted on geographies consisting of 221,001,104 people shows a moderate positive correlation between the proportion of Immigrants from Panama and percentage of population with at least professional degree education in the United States with a correlation coefficient (R) of 0.455 and weighted average of 4.1%, a difference of 45.5%.
Professional Degree Correlation Summary
| Measurement | Estonian | Immigrants from Panama |
| Minimum | 0.42% | 0.20% |
| Maximum | 17.6% | 20.0% |
| Range | 17.2% | 19.9% |
| Mean | 5.4% | 4.5% |
| Median | 5.2% | 3.6% |
| Interquartile 25% (IQ1) | 2.3% | 2.6% |
| Interquartile 75% (IQ3) | 6.8% | 4.6% |
| Interquartile Range (IQR) | 4.5% | 2.0% |
| Standard Deviation (Sample) | 3.9% | 4.2% |
| Standard Deviation (Population) | 3.8% | 4.1% |
Similar Demographics by Professional Degree
Demographics Similar to Estonians by Professional Degree
In terms of professional degree, the demographic groups most similar to Estonians are New Zealander (6.0%, a difference of 0.010%), Cambodian (6.0%, a difference of 0.19%), Immigrants from Saudi Arabia (5.9%, a difference of 0.32%), Argentinean (5.9%, a difference of 0.48%), and Immigrants from South Africa (6.0%, a difference of 0.67%).
| Demographics | Rating | Rank | Professional Degree |
| Immigrants | Korea | 100.0 /100 | #35 | Exceptional 6.1% |
| Immigrants | Russia | 100.0 /100 | #36 | Exceptional 6.0% |
| Immigrants | Austria | 100.0 /100 | #37 | Exceptional 6.0% |
| Immigrants | Norway | 100.0 /100 | #38 | Exceptional 6.0% |
| Immigrants | South Africa | 100.0 /100 | #39 | Exceptional 6.0% |
| Cambodians | 100.0 /100 | #40 | Exceptional 6.0% |
| New Zealanders | 100.0 /100 | #41 | Exceptional 6.0% |
| Estonians | 100.0 /100 | #42 | Exceptional 6.0% |
| Immigrants | Saudi Arabia | 100.0 /100 | #43 | Exceptional 5.9% |
| Argentineans | 100.0 /100 | #44 | Exceptional 5.9% |
| Immigrants | South Central Asia | 100.0 /100 | #45 | Exceptional 5.9% |
| Immigrants | Argentina | 100.0 /100 | #46 | Exceptional 5.9% |
| Australians | 100.0 /100 | #47 | Exceptional 5.9% |
| Paraguayans | 100.0 /100 | #48 | Exceptional 5.9% |
| Immigrants | Latvia | 100.0 /100 | #49 | Exceptional 5.8% |
Demographics Similar to Immigrants from Panama by Professional Degree
In terms of professional degree, the demographic groups most similar to Immigrants from Panama are Immigrants from Somalia (4.1%, a difference of 0.080%), Subsaharan African (4.1%, a difference of 0.16%), Immigrants from Nigeria (4.1%, a difference of 0.22%), German (4.1%, a difference of 0.26%), and Yugoslavian (4.1%, a difference of 0.40%).
| Demographics | Rating | Rank | Professional Degree |
| Immigrants | Iraq | 17.1 /100 | #202 | Poor 4.2% |
| Panamanians | 15.9 /100 | #203 | Poor 4.1% |
| Barbadians | 15.8 /100 | #204 | Poor 4.1% |
| Somalis | 14.8 /100 | #205 | Poor 4.1% |
| Yugoslavians | 13.4 /100 | #206 | Poor 4.1% |
| Sub-Saharan Africans | 12.8 /100 | #207 | Poor 4.1% |
| Immigrants | Somalia | 12.5 /100 | #208 | Poor 4.1% |
| Immigrants | Panama | 12.3 /100 | #209 | Poor 4.1% |
| Immigrants | Nigeria | 11.7 /100 | #210 | Poor 4.1% |
| Germans | 11.6 /100 | #211 | Poor 4.1% |
| Whites/Caucasians | 11.2 /100 | #212 | Poor 4.1% |
| Koreans | 10.7 /100 | #213 | Poor 4.1% |
| Immigrants | Ghana | 10.6 /100 | #214 | Poor 4.1% |
| Portuguese | 10.5 /100 | #215 | Poor 4.1% |
| West Indians | 9.8 /100 | #216 | Tragic 4.1% |