Estonian vs Immigrants from Kenya Professional Degree
COMPARE
Estonian
Immigrants from Kenya
Professional Degree
Professional Degree Comparison
Estonians
Immigrants from Kenya
6.0%
PROFESSIONAL DEGREE
100.0/ 100
METRIC RATING
42nd/ 347
METRIC RANK
4.4%
PROFESSIONAL DEGREE
45.9/ 100
METRIC RATING
179th/ 347
METRIC RANK
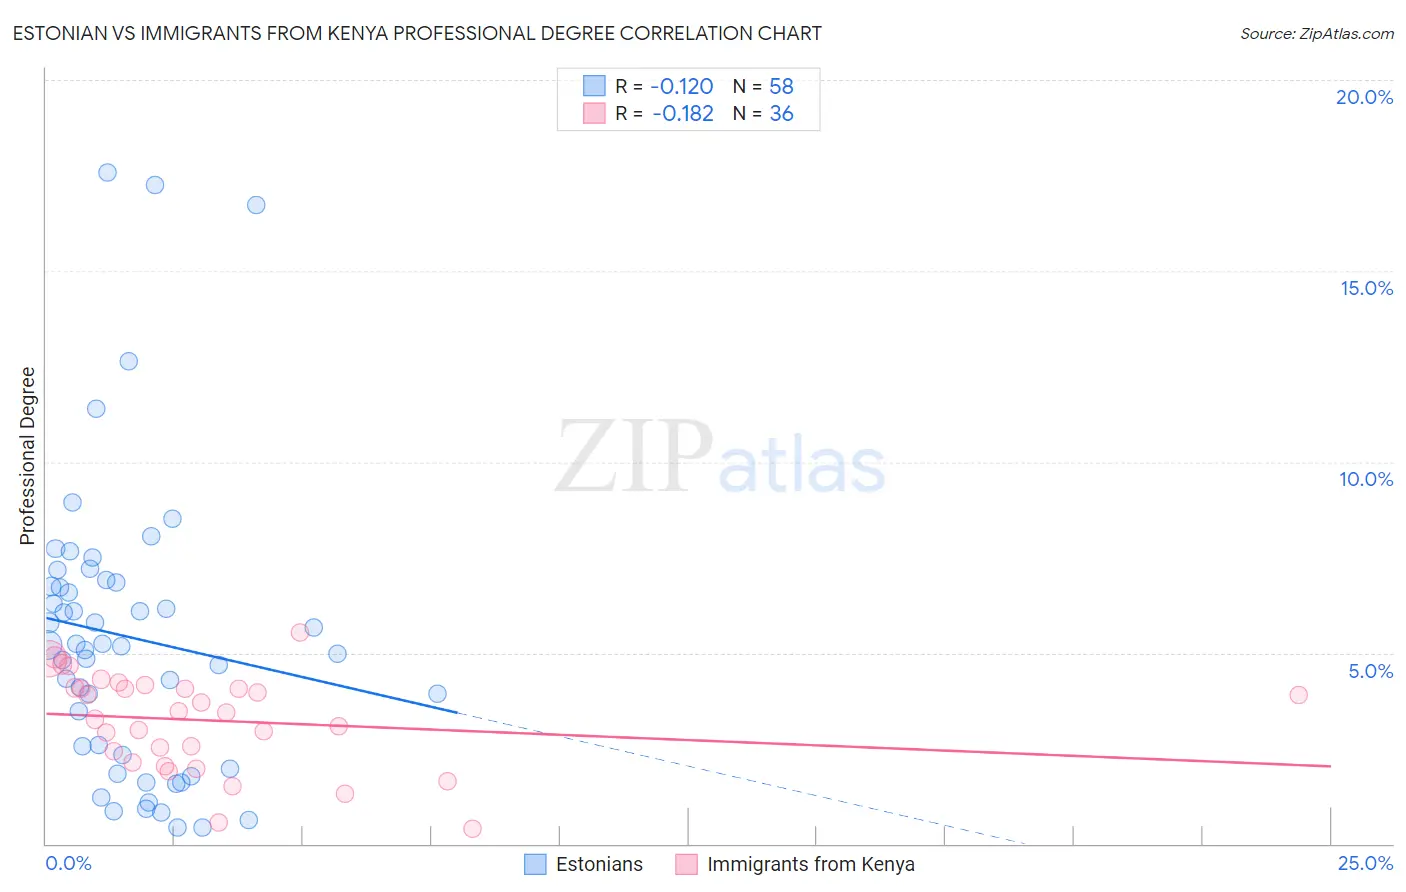
Estonian vs Immigrants from Kenya Professional Degree Correlation Chart
The statistical analysis conducted on geographies consisting of 123,468,720 people shows a poor negative correlation between the proportion of Estonians and percentage of population with at least professional degree education in the United States with a correlation coefficient (R) of -0.120 and weighted average of 6.0%. Similarly, the statistical analysis conducted on geographies consisting of 217,865,757 people shows a poor negative correlation between the proportion of Immigrants from Kenya and percentage of population with at least professional degree education in the United States with a correlation coefficient (R) of -0.182 and weighted average of 4.4%, a difference of 35.9%.
Professional Degree Correlation Summary
| Measurement | Estonian | Immigrants from Kenya |
| Minimum | 0.42% | 0.40% |
| Maximum | 17.6% | 5.5% |
| Range | 17.2% | 5.1% |
| Mean | 5.4% | 3.2% |
| Median | 5.2% | 3.5% |
| Interquartile 25% (IQ1) | 2.3% | 2.3% |
| Interquartile 75% (IQ3) | 6.8% | 4.1% |
| Interquartile Range (IQR) | 4.5% | 1.8% |
| Standard Deviation (Sample) | 3.9% | 1.3% |
| Standard Deviation (Population) | 3.8% | 1.2% |
Similar Demographics by Professional Degree
Demographics Similar to Estonians by Professional Degree
In terms of professional degree, the demographic groups most similar to Estonians are New Zealander (6.0%, a difference of 0.010%), Cambodian (6.0%, a difference of 0.19%), Immigrants from Saudi Arabia (5.9%, a difference of 0.32%), Argentinean (5.9%, a difference of 0.48%), and Immigrants from South Africa (6.0%, a difference of 0.67%).
| Demographics | Rating | Rank | Professional Degree |
| Immigrants | Korea | 100.0 /100 | #35 | Exceptional 6.1% |
| Immigrants | Russia | 100.0 /100 | #36 | Exceptional 6.0% |
| Immigrants | Austria | 100.0 /100 | #37 | Exceptional 6.0% |
| Immigrants | Norway | 100.0 /100 | #38 | Exceptional 6.0% |
| Immigrants | South Africa | 100.0 /100 | #39 | Exceptional 6.0% |
| Cambodians | 100.0 /100 | #40 | Exceptional 6.0% |
| New Zealanders | 100.0 /100 | #41 | Exceptional 6.0% |
| Estonians | 100.0 /100 | #42 | Exceptional 6.0% |
| Immigrants | Saudi Arabia | 100.0 /100 | #43 | Exceptional 5.9% |
| Argentineans | 100.0 /100 | #44 | Exceptional 5.9% |
| Immigrants | South Central Asia | 100.0 /100 | #45 | Exceptional 5.9% |
| Immigrants | Argentina | 100.0 /100 | #46 | Exceptional 5.9% |
| Australians | 100.0 /100 | #47 | Exceptional 5.9% |
| Paraguayans | 100.0 /100 | #48 | Exceptional 5.9% |
| Immigrants | Latvia | 100.0 /100 | #49 | Exceptional 5.8% |
Demographics Similar to Immigrants from Kenya by Professional Degree
In terms of professional degree, the demographic groups most similar to Immigrants from Kenya are Immigrants from Costa Rica (4.4%, a difference of 0.11%), Czech (4.4%, a difference of 0.15%), Celtic (4.4%, a difference of 0.24%), Danish (4.4%, a difference of 0.36%), and Immigrants (4.4%, a difference of 0.41%).
| Demographics | Rating | Rank | Professional Degree |
| Spaniards | 52.0 /100 | #172 | Average 4.4% |
| English | 50.1 /100 | #173 | Average 4.4% |
| Kenyans | 50.0 /100 | #174 | Average 4.4% |
| Irish | 50.0 /100 | #175 | Average 4.4% |
| Immigrants | Peru | 49.3 /100 | #176 | Average 4.4% |
| Celtics | 47.6 /100 | #177 | Average 4.4% |
| Immigrants | Costa Rica | 46.7 /100 | #178 | Average 4.4% |
| Immigrants | Kenya | 45.9 /100 | #179 | Average 4.4% |
| Czechs | 44.9 /100 | #180 | Average 4.4% |
| Danes | 43.5 /100 | #181 | Average 4.4% |
| Immigrants | Immigrants | 43.2 /100 | #182 | Average 4.4% |
| Bermudans | 43.1 /100 | #183 | Average 4.4% |
| Belgians | 36.2 /100 | #184 | Fair 4.3% |
| Welsh | 35.8 /100 | #185 | Fair 4.3% |
| Scotch-Irish | 34.2 /100 | #186 | Fair 4.3% |