Nicaraguan vs Hispanic or Latino Master's Degree
COMPARE
Nicaraguan
Hispanic or Latino
Master's Degree
Master's Degree Comparison
Nicaraguans
Hispanics or Latinos
12.5%
MASTER'S DEGREE
0.6/ 100
METRIC RATING
262nd/ 347
METRIC RANK
10.9%
MASTER'S DEGREE
0.0/ 100
METRIC RATING
316th/ 347
METRIC RANK
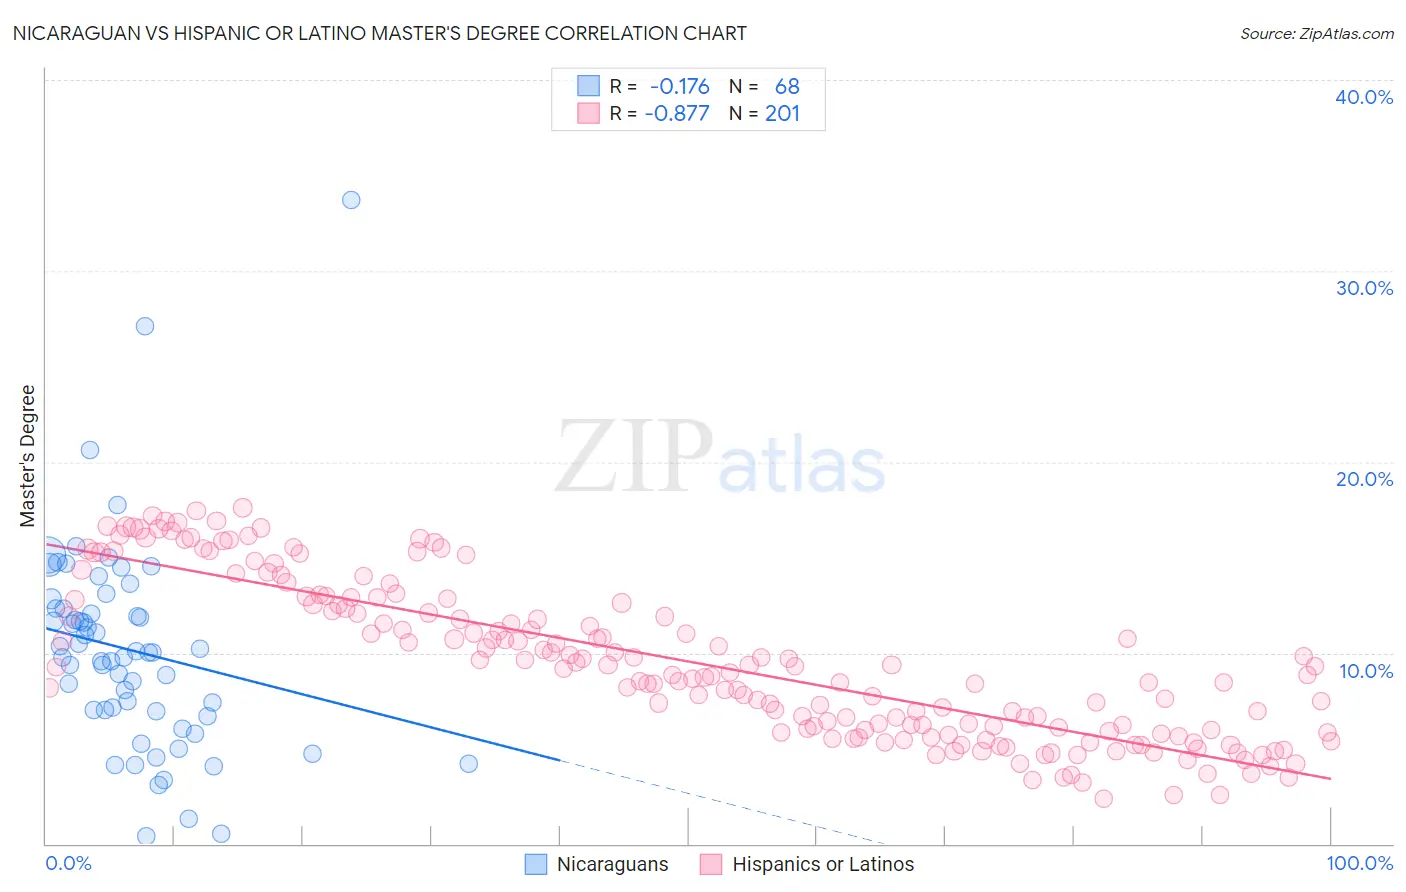
Nicaraguan vs Hispanic or Latino Master's Degree Correlation Chart
The statistical analysis conducted on geographies consisting of 285,672,078 people shows a poor negative correlation between the proportion of Nicaraguans and percentage of population with at least master's degree education in the United States with a correlation coefficient (R) of -0.176 and weighted average of 12.5%. Similarly, the statistical analysis conducted on geographies consisting of 577,228,232 people shows a very strong negative correlation between the proportion of Hispanics or Latinos and percentage of population with at least master's degree education in the United States with a correlation coefficient (R) of -0.877 and weighted average of 10.9%, a difference of 14.1%.
Master's Degree Correlation Summary
| Measurement | Nicaraguan | Hispanic or Latino |
| Minimum | 0.42% | 2.4% |
| Maximum | 33.7% | 17.6% |
| Range | 33.3% | 15.2% |
| Mean | 10.2% | 9.5% |
| Median | 10.0% | 9.2% |
| Interquartile 25% (IQ1) | 7.0% | 5.9% |
| Interquartile 75% (IQ3) | 12.3% | 12.7% |
| Interquartile Range (IQR) | 5.4% | 6.8% |
| Standard Deviation (Sample) | 5.5% | 4.1% |
| Standard Deviation (Population) | 5.4% | 4.1% |
Similar Demographics by Master's Degree
Demographics Similar to Nicaraguans by Master's Degree
In terms of master's degree, the demographic groups most similar to Nicaraguans are Tongan (12.5%, a difference of 0.18%), Dominican (12.5%, a difference of 0.22%), Japanese (12.5%, a difference of 0.23%), Central American Indian (12.4%, a difference of 0.23%), and Immigrants from Liberia (12.5%, a difference of 0.32%).
| Demographics | Rating | Rank | Master's Degree |
| Immigrants | Congo | 0.8 /100 | #255 | Tragic 12.6% |
| Immigrants | Portugal | 0.8 /100 | #256 | Tragic 12.6% |
| Osage | 0.7 /100 | #257 | Tragic 12.6% |
| Immigrants | Liberia | 0.6 /100 | #258 | Tragic 12.5% |
| Japanese | 0.6 /100 | #259 | Tragic 12.5% |
| Dominicans | 0.6 /100 | #260 | Tragic 12.5% |
| Tongans | 0.6 /100 | #261 | Tragic 12.5% |
| Nicaraguans | 0.6 /100 | #262 | Tragic 12.5% |
| Central American Indians | 0.5 /100 | #263 | Tragic 12.4% |
| Belizeans | 0.5 /100 | #264 | Tragic 12.4% |
| Immigrants | Fiji | 0.5 /100 | #265 | Tragic 12.4% |
| Bahamians | 0.5 /100 | #266 | Tragic 12.4% |
| Americans | 0.4 /100 | #267 | Tragic 12.3% |
| Native Hawaiians | 0.4 /100 | #268 | Tragic 12.3% |
| Central Americans | 0.3 /100 | #269 | Tragic 12.2% |
Demographics Similar to Hispanics or Latinos by Master's Degree
In terms of master's degree, the demographic groups most similar to Hispanics or Latinos are Apache (11.0%, a difference of 0.34%), Cajun (11.0%, a difference of 0.35%), Hopi (10.9%, a difference of 0.54%), Immigrants from Cuba (10.9%, a difference of 0.67%), and Yaqui (11.0%, a difference of 0.74%).
| Demographics | Rating | Rank | Master's Degree |
| Puget Sound Salish | 0.0 /100 | #309 | Tragic 11.1% |
| Shoshone | 0.0 /100 | #310 | Tragic 11.1% |
| Seminole | 0.0 /100 | #311 | Tragic 11.0% |
| Choctaw | 0.0 /100 | #312 | Tragic 11.0% |
| Yaqui | 0.0 /100 | #313 | Tragic 11.0% |
| Cajuns | 0.0 /100 | #314 | Tragic 11.0% |
| Apache | 0.0 /100 | #315 | Tragic 11.0% |
| Hispanics or Latinos | 0.0 /100 | #316 | Tragic 10.9% |
| Hopi | 0.0 /100 | #317 | Tragic 10.9% |
| Immigrants | Cuba | 0.0 /100 | #318 | Tragic 10.9% |
| Kiowa | 0.0 /100 | #319 | Tragic 10.8% |
| Immigrants | Micronesia | 0.0 /100 | #320 | Tragic 10.8% |
| Pennsylvania Germans | 0.0 /100 | #321 | Tragic 10.7% |
| Sioux | 0.0 /100 | #322 | Tragic 10.7% |
| Crow | 0.0 /100 | #323 | Tragic 10.6% |