Colville vs Hispanic or Latino Master's Degree
COMPARE
Colville
Hispanic or Latino
Master's Degree
Master's Degree Comparison
Colville
Hispanics or Latinos
11.6%
MASTER'S DEGREE
0.1/ 100
METRIC RATING
291st/ 347
METRIC RANK
10.9%
MASTER'S DEGREE
0.0/ 100
METRIC RATING
316th/ 347
METRIC RANK
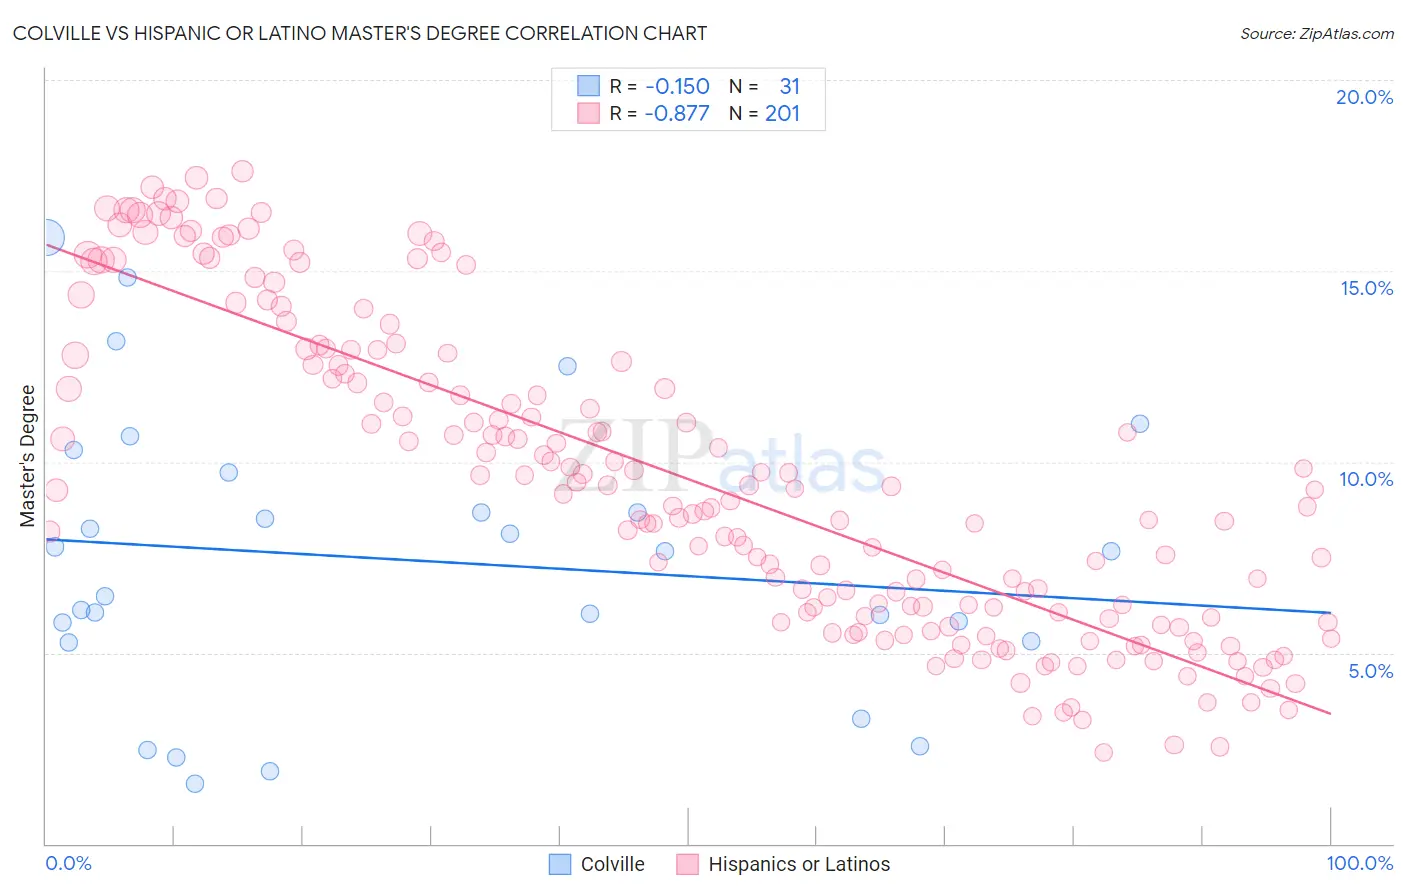
Colville vs Hispanic or Latino Master's Degree Correlation Chart
The statistical analysis conducted on geographies consisting of 34,682,548 people shows a poor negative correlation between the proportion of Colville and percentage of population with at least master's degree education in the United States with a correlation coefficient (R) of -0.150 and weighted average of 11.6%. Similarly, the statistical analysis conducted on geographies consisting of 577,228,232 people shows a very strong negative correlation between the proportion of Hispanics or Latinos and percentage of population with at least master's degree education in the United States with a correlation coefficient (R) of -0.877 and weighted average of 10.9%, a difference of 6.5%.
Master's Degree Correlation Summary
| Measurement | Colville | Hispanic or Latino |
| Minimum | 1.6% | 2.4% |
| Maximum | 15.9% | 17.6% |
| Range | 14.3% | 15.2% |
| Mean | 7.4% | 9.5% |
| Median | 7.6% | 9.2% |
| Interquartile 25% (IQ1) | 5.3% | 5.9% |
| Interquartile 75% (IQ3) | 9.7% | 12.7% |
| Interquartile Range (IQR) | 4.4% | 6.8% |
| Standard Deviation (Sample) | 3.7% | 4.1% |
| Standard Deviation (Population) | 3.6% | 4.1% |
Similar Demographics by Master's Degree
Demographics Similar to Colville by Master's Degree
In terms of master's degree, the demographic groups most similar to Colville are Immigrants from Guatemala (11.6%, a difference of 0.13%), Alaska Native (11.6%, a difference of 0.35%), Hawaiian (11.6%, a difference of 0.45%), Marshallese (11.6%, a difference of 0.60%), and Alaskan Athabascan (11.6%, a difference of 0.61%).
| Demographics | Rating | Rank | Master's Degree |
| Ottawa | 0.2 /100 | #284 | Tragic 11.9% |
| Immigrants | Nicaragua | 0.2 /100 | #285 | Tragic 11.8% |
| Aleuts | 0.1 /100 | #286 | Tragic 11.8% |
| Immigrants | Haiti | 0.1 /100 | #287 | Tragic 11.8% |
| Immigrants | Honduras | 0.1 /100 | #288 | Tragic 11.8% |
| Guatemalans | 0.1 /100 | #289 | Tragic 11.7% |
| Ute | 0.1 /100 | #290 | Tragic 11.7% |
| Colville | 0.1 /100 | #291 | Tragic 11.6% |
| Immigrants | Guatemala | 0.1 /100 | #292 | Tragic 11.6% |
| Alaska Natives | 0.1 /100 | #293 | Tragic 11.6% |
| Hawaiians | 0.1 /100 | #294 | Tragic 11.6% |
| Marshallese | 0.1 /100 | #295 | Tragic 11.6% |
| Alaskan Athabascans | 0.1 /100 | #296 | Tragic 11.6% |
| Immigrants | Yemen | 0.1 /100 | #297 | Tragic 11.6% |
| Samoans | 0.1 /100 | #298 | Tragic 11.5% |
Demographics Similar to Hispanics or Latinos by Master's Degree
In terms of master's degree, the demographic groups most similar to Hispanics or Latinos are Apache (11.0%, a difference of 0.34%), Cajun (11.0%, a difference of 0.35%), Hopi (10.9%, a difference of 0.54%), Immigrants from Cuba (10.9%, a difference of 0.67%), and Yaqui (11.0%, a difference of 0.74%).
| Demographics | Rating | Rank | Master's Degree |
| Puget Sound Salish | 0.0 /100 | #309 | Tragic 11.1% |
| Shoshone | 0.0 /100 | #310 | Tragic 11.1% |
| Seminole | 0.0 /100 | #311 | Tragic 11.0% |
| Choctaw | 0.0 /100 | #312 | Tragic 11.0% |
| Yaqui | 0.0 /100 | #313 | Tragic 11.0% |
| Cajuns | 0.0 /100 | #314 | Tragic 11.0% |
| Apache | 0.0 /100 | #315 | Tragic 11.0% |
| Hispanics or Latinos | 0.0 /100 | #316 | Tragic 10.9% |
| Hopi | 0.0 /100 | #317 | Tragic 10.9% |
| Immigrants | Cuba | 0.0 /100 | #318 | Tragic 10.9% |
| Kiowa | 0.0 /100 | #319 | Tragic 10.8% |
| Immigrants | Micronesia | 0.0 /100 | #320 | Tragic 10.8% |
| Pennsylvania Germans | 0.0 /100 | #321 | Tragic 10.7% |
| Sioux | 0.0 /100 | #322 | Tragic 10.7% |
| Crow | 0.0 /100 | #323 | Tragic 10.6% |