Russian vs Lithuanian 6th Grade
COMPARE
Russian
Lithuanian
6th Grade
6th Grade Comparison
Russians
Lithuanians
97.7%
6TH GRADE
99.7/ 100
METRIC RATING
63rd/ 347
METRIC RANK
98.1%
6TH GRADE
100.0/ 100
METRIC RATING
21st/ 347
METRIC RANK
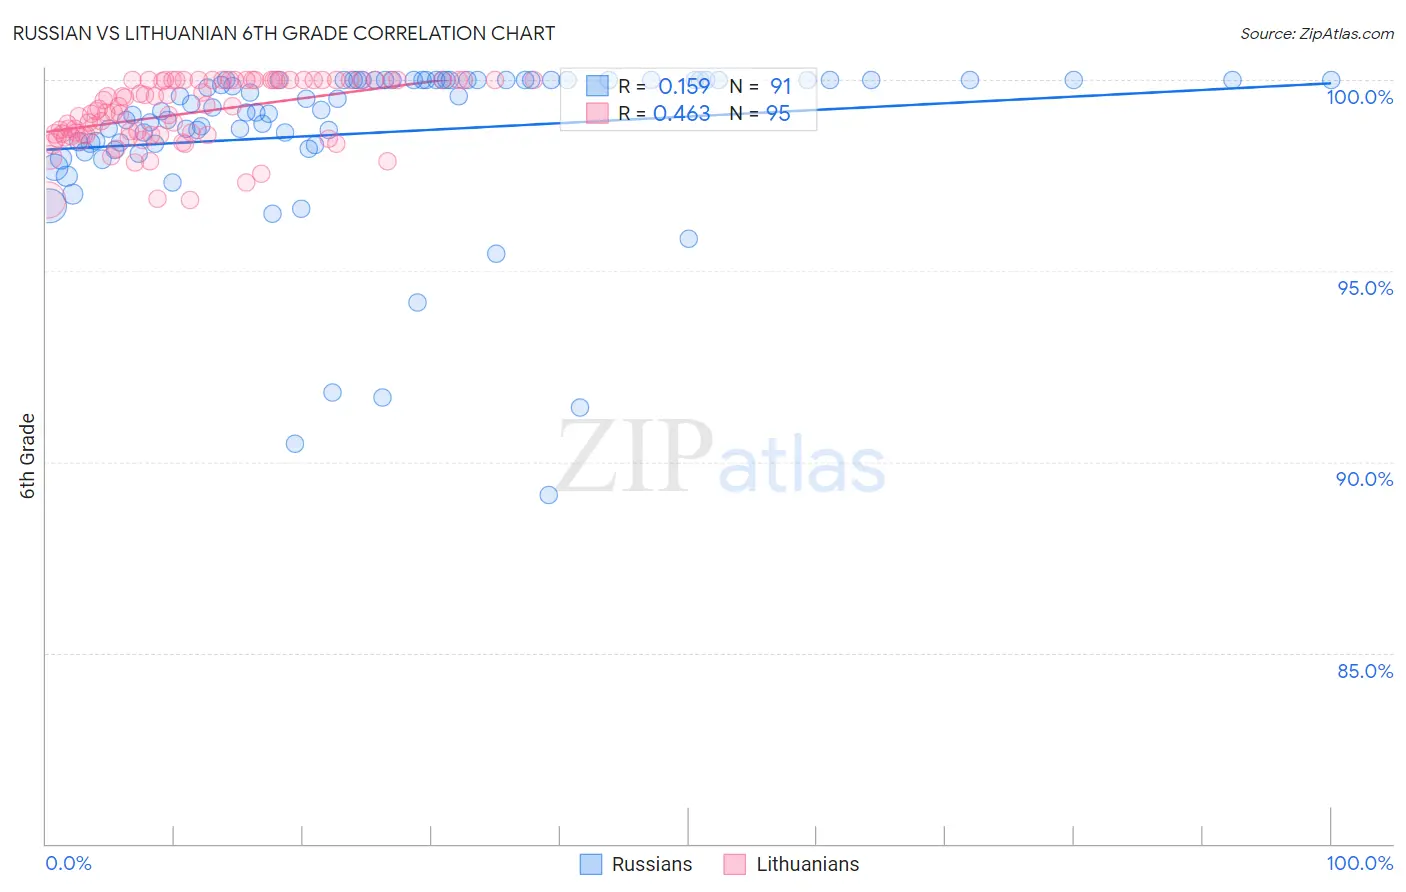
Russian vs Lithuanian 6th Grade Correlation Chart
The statistical analysis conducted on geographies consisting of 512,259,047 people shows a poor positive correlation between the proportion of Russians and percentage of population with at least 6th grade education in the United States with a correlation coefficient (R) of 0.159 and weighted average of 97.7%. Similarly, the statistical analysis conducted on geographies consisting of 421,945,620 people shows a moderate positive correlation between the proportion of Lithuanians and percentage of population with at least 6th grade education in the United States with a correlation coefficient (R) of 0.463 and weighted average of 98.1%, a difference of 0.38%.
6th Grade Correlation Summary
| Measurement | Russian | Lithuanian |
| Minimum | 89.1% | 96.9% |
| Maximum | 100.0% | 100.0% |
| Range | 10.9% | 3.1% |
| Mean | 98.6% | 99.1% |
| Median | 99.3% | 99.2% |
| Interquartile 25% (IQ1) | 98.3% | 98.6% |
| Interquartile 75% (IQ3) | 100.0% | 100.0% |
| Interquartile Range (IQR) | 1.7% | 1.4% |
| Standard Deviation (Sample) | 2.2% | 0.84% |
| Standard Deviation (Population) | 2.2% | 0.84% |
Similar Demographics by 6th Grade
Demographics Similar to Russians by 6th Grade
In terms of 6th grade, the demographic groups most similar to Russians are Immigrants from North America (97.7%, a difference of 0.010%), Canadian (97.7%, a difference of 0.010%), Immigrants from Canada (97.7%, a difference of 0.020%), Serbian (97.7%, a difference of 0.020%), and Immigrants from Northern Europe (97.7%, a difference of 0.020%).
| Demographics | Rating | Rank | 6th Grade |
| Austrians | 99.8 /100 | #56 | Exceptional 97.7% |
| Whites/Caucasians | 99.8 /100 | #57 | Exceptional 97.7% |
| Greeks | 99.8 /100 | #58 | Exceptional 97.7% |
| Americans | 99.8 /100 | #59 | Exceptional 97.7% |
| Immigrants | Canada | 99.8 /100 | #60 | Exceptional 97.7% |
| Serbians | 99.7 /100 | #61 | Exceptional 97.7% |
| Immigrants | North America | 99.7 /100 | #62 | Exceptional 97.7% |
| Russians | 99.7 /100 | #63 | Exceptional 97.7% |
| Canadians | 99.7 /100 | #64 | Exceptional 97.7% |
| Immigrants | Northern Europe | 99.6 /100 | #65 | Exceptional 97.7% |
| New Zealanders | 99.6 /100 | #66 | Exceptional 97.7% |
| Kiowa | 99.6 /100 | #67 | Exceptional 97.7% |
| Immigrants | Austria | 99.6 /100 | #68 | Exceptional 97.7% |
| Iranians | 99.6 /100 | #69 | Exceptional 97.6% |
| Cajuns | 99.5 /100 | #70 | Exceptional 97.6% |
Demographics Similar to Lithuanians by 6th Grade
In terms of 6th grade, the demographic groups most similar to Lithuanians are Finnish (98.1%, a difference of 0.010%), Danish (98.0%, a difference of 0.020%), Polish (98.1%, a difference of 0.030%), Pennsylvania German (98.1%, a difference of 0.030%), and Irish (98.1%, a difference of 0.030%).
| Demographics | Rating | Rank | 6th Grade |
| Carpatho Rusyns | 100.0 /100 | #14 | Exceptional 98.1% |
| Inupiat | 100.0 /100 | #15 | Exceptional 98.1% |
| Scottish | 100.0 /100 | #16 | Exceptional 98.1% |
| Poles | 100.0 /100 | #17 | Exceptional 98.1% |
| Pennsylvania Germans | 100.0 /100 | #18 | Exceptional 98.1% |
| Irish | 100.0 /100 | #19 | Exceptional 98.1% |
| Finns | 100.0 /100 | #20 | Exceptional 98.1% |
| Lithuanians | 100.0 /100 | #21 | Exceptional 98.1% |
| Danes | 100.0 /100 | #22 | Exceptional 98.0% |
| Sioux | 100.0 /100 | #23 | Exceptional 98.0% |
| Croatians | 100.0 /100 | #24 | Exceptional 98.0% |
| Scotch-Irish | 100.0 /100 | #25 | Exceptional 98.0% |
| Czechs | 100.0 /100 | #26 | Exceptional 98.0% |
| Yup'ik | 100.0 /100 | #27 | Exceptional 98.0% |
| Scandinavians | 100.0 /100 | #28 | Exceptional 98.0% |