Ecuadorian vs Immigrants from Uruguay 8th Grade
COMPARE
Ecuadorian
Immigrants from Uruguay
8th Grade
8th Grade Comparison
Ecuadorians
Immigrants from Uruguay
93.6%
8TH GRADE
0.0/ 100
METRIC RATING
308th/ 347
METRIC RANK
94.8%
8TH GRADE
0.3/ 100
METRIC RATING
268th/ 347
METRIC RANK
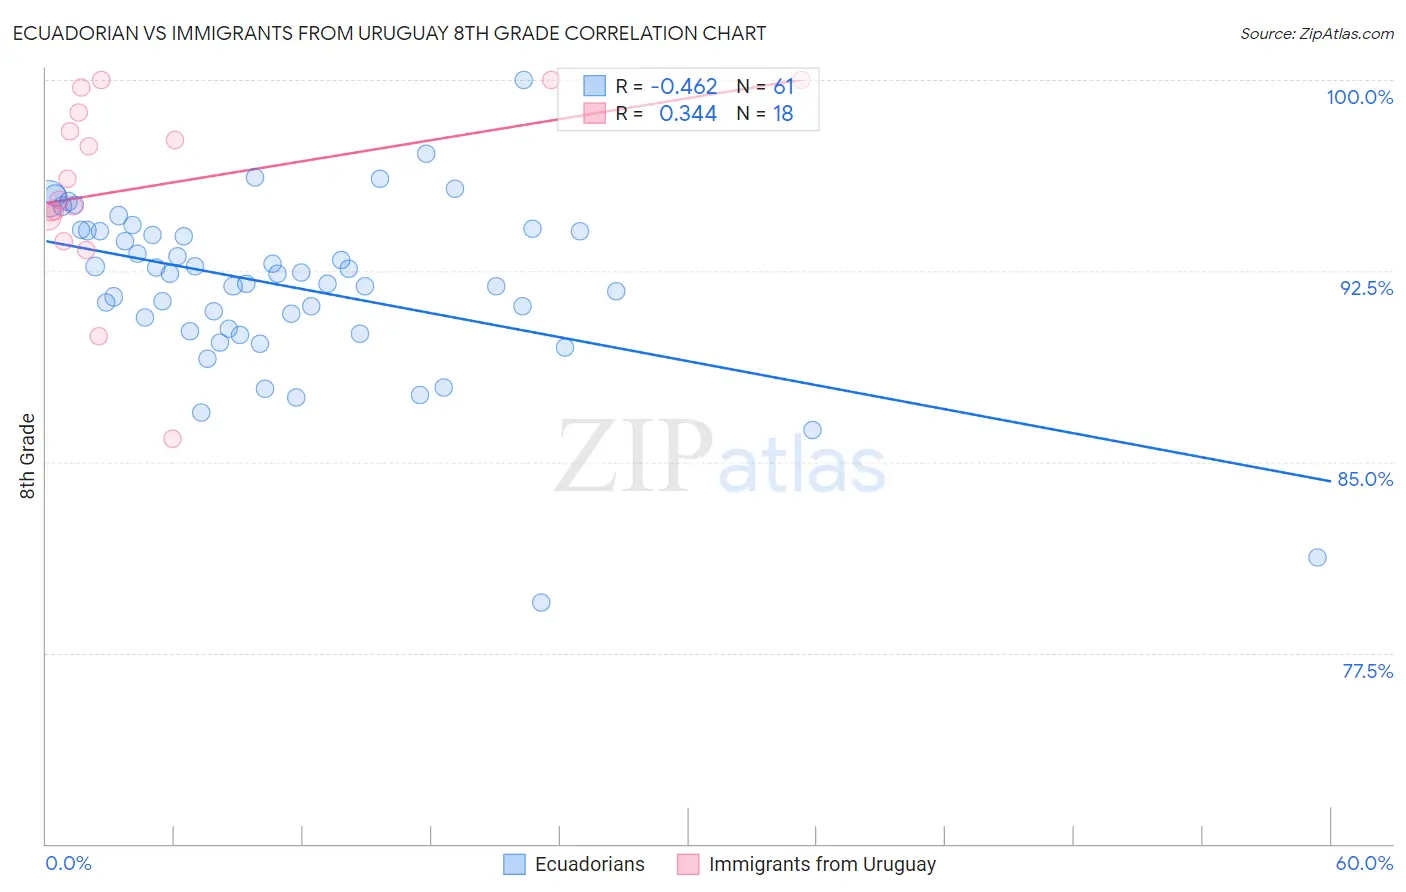
Ecuadorian vs Immigrants from Uruguay 8th Grade Correlation Chart
The statistical analysis conducted on geographies consisting of 317,753,005 people shows a moderate negative correlation between the proportion of Ecuadorians and percentage of population with at least 8th grade education in the United States with a correlation coefficient (R) of -0.462 and weighted average of 93.6%. Similarly, the statistical analysis conducted on geographies consisting of 133,259,667 people shows a mild positive correlation between the proportion of Immigrants from Uruguay and percentage of population with at least 8th grade education in the United States with a correlation coefficient (R) of 0.344 and weighted average of 94.8%, a difference of 1.3%.
8th Grade Correlation Summary
| Measurement | Ecuadorian | Immigrants from Uruguay |
| Minimum | 79.5% | 85.9% |
| Maximum | 100.0% | 100.0% |
| Range | 20.5% | 14.1% |
| Mean | 91.9% | 95.8% |
| Median | 92.4% | 95.7% |
| Interquartile 25% (IQ1) | 90.2% | 94.7% |
| Interquartile 75% (IQ3) | 94.1% | 98.7% |
| Interquartile Range (IQR) | 3.9% | 4.1% |
| Standard Deviation (Sample) | 3.4% | 3.7% |
| Standard Deviation (Population) | 3.4% | 3.6% |
Similar Demographics by 8th Grade
Demographics Similar to Ecuadorians by 8th Grade
In terms of 8th grade, the demographic groups most similar to Ecuadorians are Immigrants (93.6%, a difference of 0.020%), Japanese (93.6%, a difference of 0.030%), Immigrants from Bangladesh (93.6%, a difference of 0.030%), Cape Verdean (93.5%, a difference of 0.070%), and Immigrants from Caribbean (93.5%, a difference of 0.10%).
| Demographics | Rating | Rank | 8th Grade |
| Immigrants | Laos | 0.0 /100 | #301 | Tragic 94.1% |
| Sri Lankans | 0.0 /100 | #302 | Tragic 94.0% |
| Immigrants | Dominica | 0.0 /100 | #303 | Tragic 94.0% |
| Guyanese | 0.0 /100 | #304 | Tragic 93.9% |
| Immigrants | Haiti | 0.0 /100 | #305 | Tragic 93.9% |
| Immigrants | Guyana | 0.0 /100 | #306 | Tragic 93.8% |
| Immigrants | Portugal | 0.0 /100 | #307 | Tragic 93.8% |
| Ecuadorians | 0.0 /100 | #308 | Tragic 93.6% |
| Immigrants | Immigrants | 0.0 /100 | #309 | Tragic 93.6% |
| Japanese | 0.0 /100 | #310 | Tragic 93.6% |
| Immigrants | Bangladesh | 0.0 /100 | #311 | Tragic 93.6% |
| Cape Verdeans | 0.0 /100 | #312 | Tragic 93.5% |
| Immigrants | Caribbean | 0.0 /100 | #313 | Tragic 93.5% |
| Immigrants | Vietnam | 0.0 /100 | #314 | Tragic 93.5% |
| Vietnamese | 0.0 /100 | #315 | Tragic 93.5% |
Demographics Similar to Immigrants from Uruguay by 8th Grade
In terms of 8th grade, the demographic groups most similar to Immigrants from Uruguay are Immigrants from Ghana (94.8%, a difference of 0.0%), West Indian (94.8%, a difference of 0.020%), Immigrants from Thailand (94.8%, a difference of 0.020%), Immigrants from Uzbekistan (94.8%, a difference of 0.040%), and Immigrants from Afghanistan (94.8%, a difference of 0.050%).
| Demographics | Rating | Rank | 8th Grade |
| Immigrants | Costa Rica | 0.5 /100 | #261 | Tragic 94.9% |
| Immigrants | Nigeria | 0.4 /100 | #262 | Tragic 94.9% |
| Immigrants | Hong Kong | 0.4 /100 | #263 | Tragic 94.9% |
| South Americans | 0.4 /100 | #264 | Tragic 94.9% |
| Yuman | 0.4 /100 | #265 | Tragic 94.9% |
| West Indians | 0.3 /100 | #266 | Tragic 94.8% |
| Immigrants | Ghana | 0.3 /100 | #267 | Tragic 94.8% |
| Immigrants | Uruguay | 0.3 /100 | #268 | Tragic 94.8% |
| Immigrants | Thailand | 0.2 /100 | #269 | Tragic 94.8% |
| Immigrants | Uzbekistan | 0.2 /100 | #270 | Tragic 94.8% |
| Immigrants | Afghanistan | 0.2 /100 | #271 | Tragic 94.8% |
| Immigrants | South America | 0.2 /100 | #272 | Tragic 94.8% |
| Immigrants | Western Africa | 0.2 /100 | #273 | Tragic 94.8% |
| Trinidadians and Tobagonians | 0.2 /100 | #274 | Tragic 94.7% |
| Immigrants | Colombia | 0.2 /100 | #275 | Tragic 94.7% |