Ecuadorian vs Zimbabwean 8th Grade
COMPARE
Ecuadorian
Zimbabwean
8th Grade
8th Grade Comparison
Ecuadorians
Zimbabweans
93.6%
8TH GRADE
0.0/ 100
METRIC RATING
308th/ 347
METRIC RANK
96.5%
8TH GRADE
99.4/ 100
METRIC RATING
75th/ 347
METRIC RANK
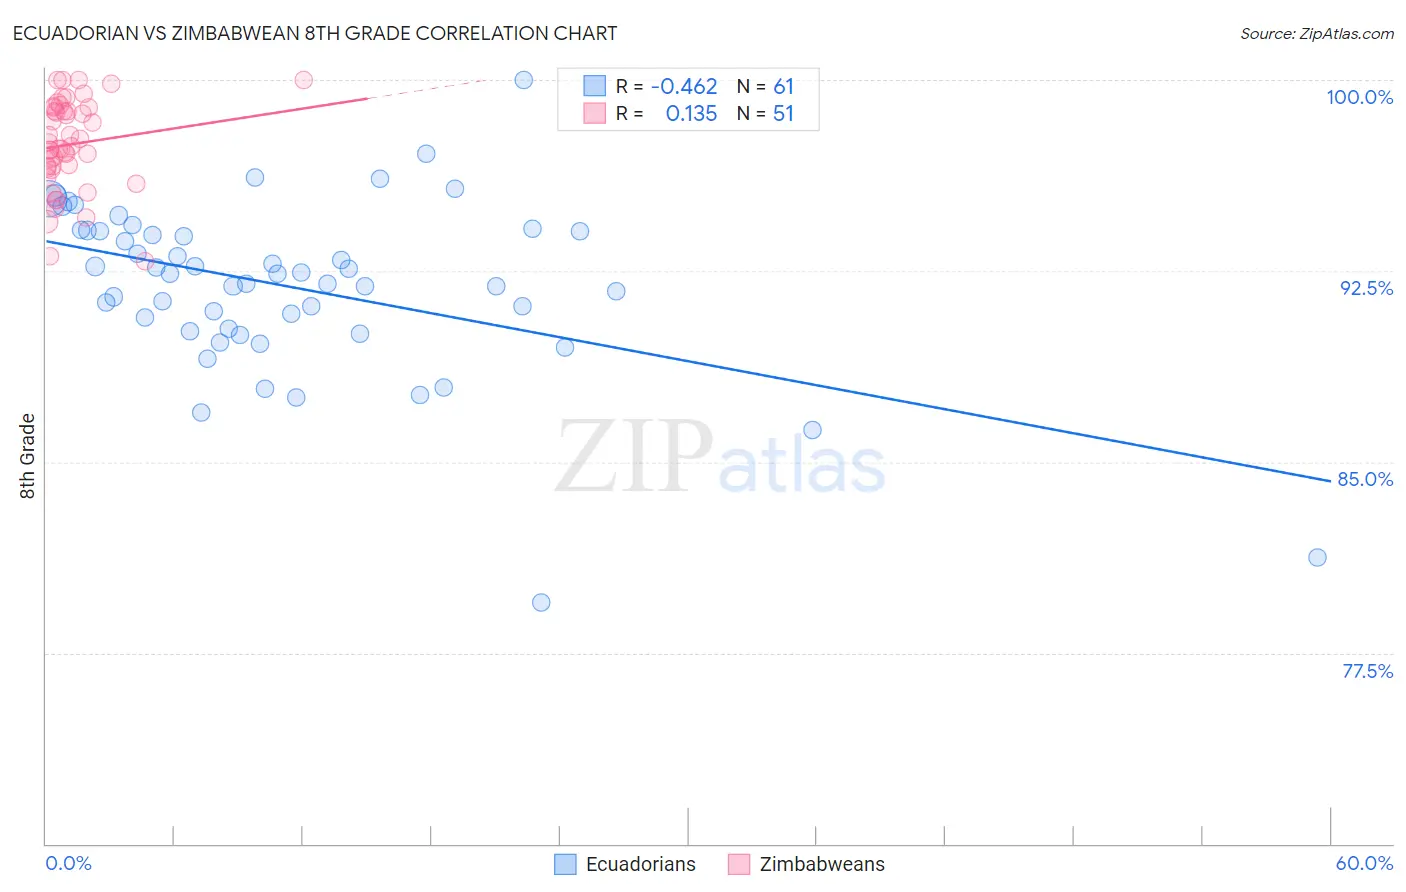
Ecuadorian vs Zimbabwean 8th Grade Correlation Chart
The statistical analysis conducted on geographies consisting of 317,753,005 people shows a moderate negative correlation between the proportion of Ecuadorians and percentage of population with at least 8th grade education in the United States with a correlation coefficient (R) of -0.462 and weighted average of 93.6%. Similarly, the statistical analysis conducted on geographies consisting of 69,203,423 people shows a poor positive correlation between the proportion of Zimbabweans and percentage of population with at least 8th grade education in the United States with a correlation coefficient (R) of 0.135 and weighted average of 96.5%, a difference of 3.1%.
8th Grade Correlation Summary
| Measurement | Ecuadorian | Zimbabwean |
| Minimum | 79.5% | 92.9% |
| Maximum | 100.0% | 100.0% |
| Range | 20.5% | 7.1% |
| Mean | 91.9% | 97.5% |
| Median | 92.4% | 97.4% |
| Interquartile 25% (IQ1) | 90.2% | 96.6% |
| Interquartile 75% (IQ3) | 94.1% | 98.9% |
| Interquartile Range (IQR) | 3.9% | 2.4% |
| Standard Deviation (Sample) | 3.4% | 1.8% |
| Standard Deviation (Population) | 3.4% | 1.7% |
Similar Demographics by 8th Grade
Demographics Similar to Ecuadorians by 8th Grade
In terms of 8th grade, the demographic groups most similar to Ecuadorians are Immigrants (93.6%, a difference of 0.020%), Japanese (93.6%, a difference of 0.030%), Immigrants from Bangladesh (93.6%, a difference of 0.030%), Cape Verdean (93.5%, a difference of 0.070%), and Immigrants from Caribbean (93.5%, a difference of 0.10%).
| Demographics | Rating | Rank | 8th Grade |
| Immigrants | Laos | 0.0 /100 | #301 | Tragic 94.1% |
| Sri Lankans | 0.0 /100 | #302 | Tragic 94.0% |
| Immigrants | Dominica | 0.0 /100 | #303 | Tragic 94.0% |
| Guyanese | 0.0 /100 | #304 | Tragic 93.9% |
| Immigrants | Haiti | 0.0 /100 | #305 | Tragic 93.9% |
| Immigrants | Guyana | 0.0 /100 | #306 | Tragic 93.8% |
| Immigrants | Portugal | 0.0 /100 | #307 | Tragic 93.8% |
| Ecuadorians | 0.0 /100 | #308 | Tragic 93.6% |
| Immigrants | Immigrants | 0.0 /100 | #309 | Tragic 93.6% |
| Japanese | 0.0 /100 | #310 | Tragic 93.6% |
| Immigrants | Bangladesh | 0.0 /100 | #311 | Tragic 93.6% |
| Cape Verdeans | 0.0 /100 | #312 | Tragic 93.5% |
| Immigrants | Caribbean | 0.0 /100 | #313 | Tragic 93.5% |
| Immigrants | Vietnam | 0.0 /100 | #314 | Tragic 93.5% |
| Vietnamese | 0.0 /100 | #315 | Tragic 93.5% |
Demographics Similar to Zimbabweans by 8th Grade
In terms of 8th grade, the demographic groups most similar to Zimbabweans are Immigrants from Netherlands (96.5%, a difference of 0.0%), Immigrants from Ireland (96.5%, a difference of 0.010%), Cypriot (96.5%, a difference of 0.010%), Yugoslavian (96.5%, a difference of 0.010%), and New Zealander (96.6%, a difference of 0.020%).
| Demographics | Rating | Rank | 8th Grade |
| Creek | 99.7 /100 | #68 | Exceptional 96.6% |
| Americans | 99.7 /100 | #69 | Exceptional 96.6% |
| Immigrants | Lithuania | 99.6 /100 | #70 | Exceptional 96.6% |
| New Zealanders | 99.5 /100 | #71 | Exceptional 96.6% |
| Immigrants | England | 99.5 /100 | #72 | Exceptional 96.6% |
| Arapaho | 99.5 /100 | #73 | Exceptional 96.6% |
| Immigrants | Ireland | 99.5 /100 | #74 | Exceptional 96.5% |
| Zimbabweans | 99.4 /100 | #75 | Exceptional 96.5% |
| Immigrants | Netherlands | 99.4 /100 | #76 | Exceptional 96.5% |
| Cypriots | 99.4 /100 | #77 | Exceptional 96.5% |
| Yugoslavians | 99.4 /100 | #78 | Exceptional 96.5% |
| Puget Sound Salish | 99.3 /100 | #79 | Exceptional 96.5% |
| Delaware | 99.2 /100 | #80 | Exceptional 96.5% |
| Romanians | 99.2 /100 | #81 | Exceptional 96.5% |
| Turks | 99.2 /100 | #82 | Exceptional 96.5% |