Ecuadorian vs Navajo 8th Grade
COMPARE
Ecuadorian
Navajo
8th Grade
8th Grade Comparison
Ecuadorians
Navajo
93.6%
8TH GRADE
0.0/ 100
METRIC RATING
308th/ 347
METRIC RANK
95.3%
8TH GRADE
5.7/ 100
METRIC RATING
226th/ 347
METRIC RANK
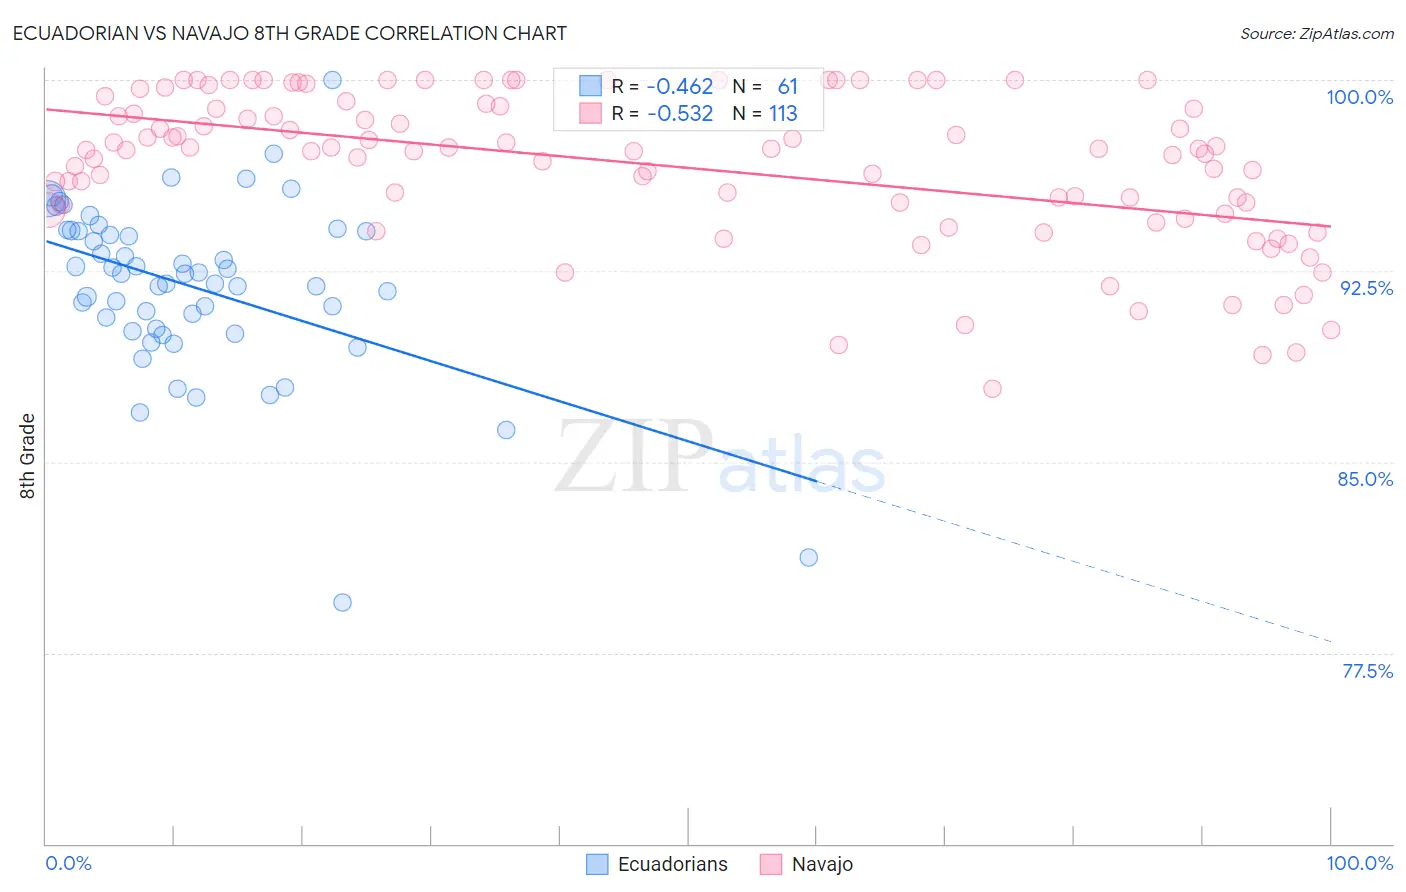
Ecuadorian vs Navajo 8th Grade Correlation Chart
The statistical analysis conducted on geographies consisting of 317,753,005 people shows a moderate negative correlation between the proportion of Ecuadorians and percentage of population with at least 8th grade education in the United States with a correlation coefficient (R) of -0.462 and weighted average of 93.6%. Similarly, the statistical analysis conducted on geographies consisting of 224,871,905 people shows a substantial negative correlation between the proportion of Navajo and percentage of population with at least 8th grade education in the United States with a correlation coefficient (R) of -0.532 and weighted average of 95.3%, a difference of 1.8%.
8th Grade Correlation Summary
| Measurement | Ecuadorian | Navajo |
| Minimum | 79.5% | 87.9% |
| Maximum | 100.0% | 100.0% |
| Range | 20.5% | 12.1% |
| Mean | 91.9% | 96.6% |
| Median | 92.4% | 97.3% |
| Interquartile 25% (IQ1) | 90.2% | 95.0% |
| Interquartile 75% (IQ3) | 94.1% | 99.0% |
| Interquartile Range (IQR) | 3.9% | 4.0% |
| Standard Deviation (Sample) | 3.4% | 2.9% |
| Standard Deviation (Population) | 3.4% | 2.9% |
Similar Demographics by 8th Grade
Demographics Similar to Ecuadorians by 8th Grade
In terms of 8th grade, the demographic groups most similar to Ecuadorians are Immigrants (93.6%, a difference of 0.020%), Japanese (93.6%, a difference of 0.030%), Immigrants from Bangladesh (93.6%, a difference of 0.030%), Cape Verdean (93.5%, a difference of 0.070%), and Immigrants from Caribbean (93.5%, a difference of 0.10%).
| Demographics | Rating | Rank | 8th Grade |
| Immigrants | Laos | 0.0 /100 | #301 | Tragic 94.1% |
| Sri Lankans | 0.0 /100 | #302 | Tragic 94.0% |
| Immigrants | Dominica | 0.0 /100 | #303 | Tragic 94.0% |
| Guyanese | 0.0 /100 | #304 | Tragic 93.9% |
| Immigrants | Haiti | 0.0 /100 | #305 | Tragic 93.9% |
| Immigrants | Guyana | 0.0 /100 | #306 | Tragic 93.8% |
| Immigrants | Portugal | 0.0 /100 | #307 | Tragic 93.8% |
| Ecuadorians | 0.0 /100 | #308 | Tragic 93.6% |
| Immigrants | Immigrants | 0.0 /100 | #309 | Tragic 93.6% |
| Japanese | 0.0 /100 | #310 | Tragic 93.6% |
| Immigrants | Bangladesh | 0.0 /100 | #311 | Tragic 93.6% |
| Cape Verdeans | 0.0 /100 | #312 | Tragic 93.5% |
| Immigrants | Caribbean | 0.0 /100 | #313 | Tragic 93.5% |
| Immigrants | Vietnam | 0.0 /100 | #314 | Tragic 93.5% |
| Vietnamese | 0.0 /100 | #315 | Tragic 93.5% |
Demographics Similar to Navajo by 8th Grade
In terms of 8th grade, the demographic groups most similar to Navajo are Bahamian (95.3%, a difference of 0.0%), Immigrants from Western Asia (95.3%, a difference of 0.010%), Subsaharan African (95.3%, a difference of 0.010%), Immigrants from Eastern Africa (95.3%, a difference of 0.010%), and Immigrants from Malaysia (95.3%, a difference of 0.040%).
| Demographics | Rating | Rank | 8th Grade |
| Spanish Americans | 8.0 /100 | #219 | Tragic 95.4% |
| Immigrants | Southern Europe | 7.7 /100 | #220 | Tragic 95.3% |
| Immigrants | Syria | 7.4 /100 | #221 | Tragic 95.3% |
| Immigrants | Malaysia | 7.3 /100 | #222 | Tragic 95.3% |
| Immigrants | Oceania | 7.1 /100 | #223 | Tragic 95.3% |
| Immigrants | Western Asia | 6.0 /100 | #224 | Tragic 95.3% |
| Sub-Saharan Africans | 6.0 /100 | #225 | Tragic 95.3% |
| Navajo | 5.7 /100 | #226 | Tragic 95.3% |
| Bahamians | 5.6 /100 | #227 | Tragic 95.3% |
| Immigrants | Eastern Africa | 5.6 /100 | #228 | Tragic 95.3% |
| Immigrants | Indonesia | 4.4 /100 | #229 | Tragic 95.3% |
| Immigrants | Panama | 4.1 /100 | #230 | Tragic 95.2% |
| Asians | 3.5 /100 | #231 | Tragic 95.2% |
| Indians (Asian) | 3.3 /100 | #232 | Tragic 95.2% |
| Immigrants | Asia | 3.1 /100 | #233 | Tragic 95.2% |