Ecuadorian vs Immigrants from Eastern Africa 7th Grade
COMPARE
Ecuadorian
Immigrants from Eastern Africa
7th Grade
7th Grade Comparison
Ecuadorians
Immigrants from Eastern Africa
94.0%
7TH GRADE
0.0/ 100
METRIC RATING
309th/ 347
METRIC RANK
95.6%
7TH GRADE
5.1/ 100
METRIC RATING
228th/ 347
METRIC RANK
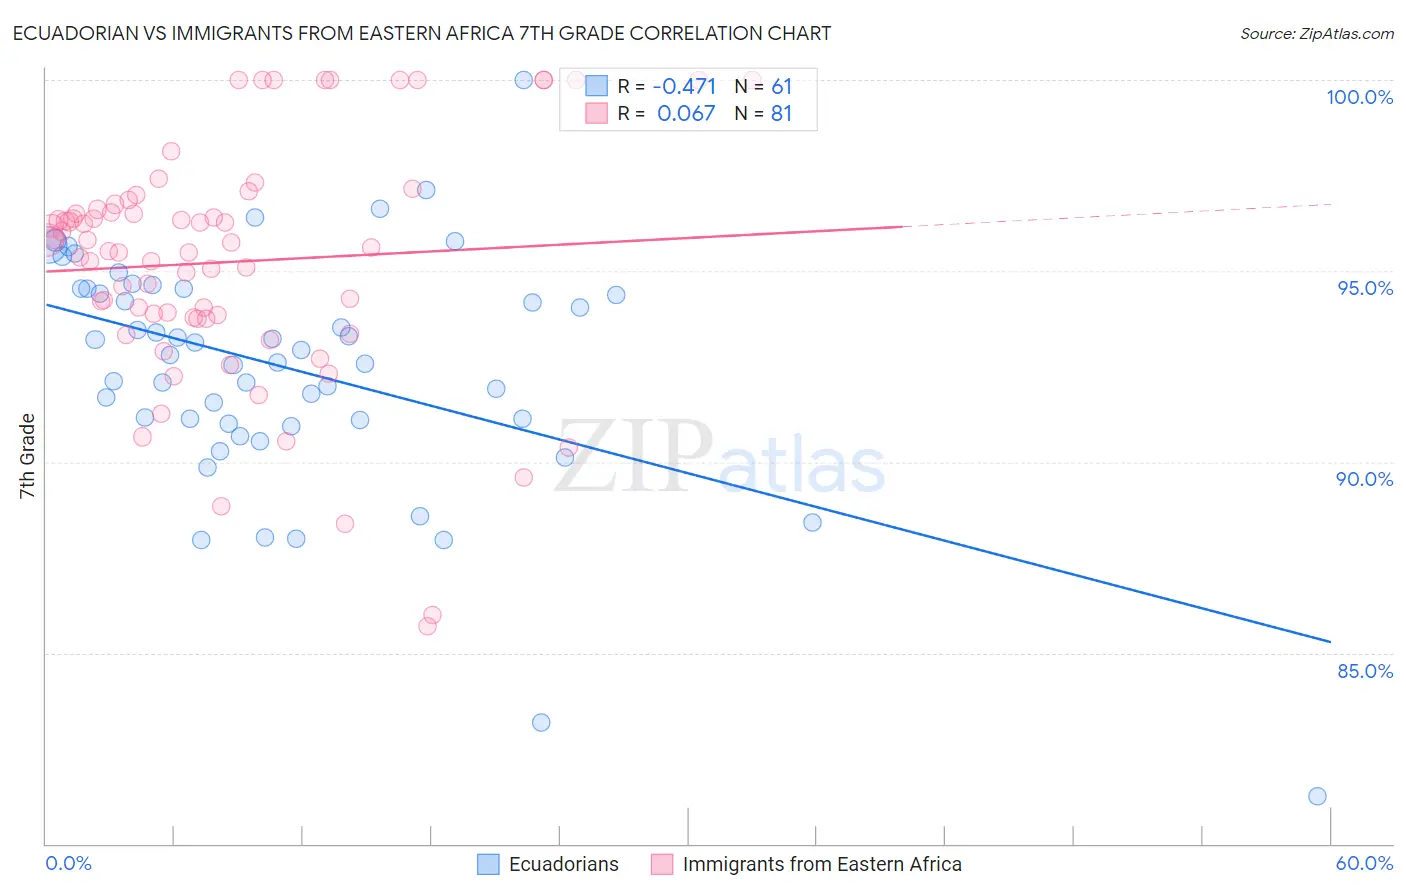
Ecuadorian vs Immigrants from Eastern Africa 7th Grade Correlation Chart
The statistical analysis conducted on geographies consisting of 317,753,005 people shows a moderate negative correlation between the proportion of Ecuadorians and percentage of population with at least 7th grade education in the United States with a correlation coefficient (R) of -0.471 and weighted average of 94.0%. Similarly, the statistical analysis conducted on geographies consisting of 355,144,184 people shows a slight positive correlation between the proportion of Immigrants from Eastern Africa and percentage of population with at least 7th grade education in the United States with a correlation coefficient (R) of 0.067 and weighted average of 95.6%, a difference of 1.7%.
7th Grade Correlation Summary
| Measurement | Ecuadorian | Immigrants from Eastern Africa |
| Minimum | 81.2% | 85.7% |
| Maximum | 100.0% | 100.0% |
| Range | 18.7% | 14.3% |
| Mean | 92.4% | 95.2% |
| Median | 92.8% | 95.6% |
| Interquartile 25% (IQ1) | 91.0% | 93.8% |
| Interquartile 75% (IQ3) | 94.5% | 96.7% |
| Interquartile Range (IQR) | 3.5% | 2.9% |
| Standard Deviation (Sample) | 3.1% | 3.1% |
| Standard Deviation (Population) | 3.1% | 3.1% |
Similar Demographics by 7th Grade
Demographics Similar to Ecuadorians by 7th Grade
In terms of 7th grade, the demographic groups most similar to Ecuadorians are Immigrants from Caribbean (94.0%, a difference of 0.010%), Puerto Rican (94.0%, a difference of 0.020%), Cape Verdean (94.1%, a difference of 0.060%), Immigrants (94.0%, a difference of 0.060%), and Immigrants from Bangladesh (94.0%, a difference of 0.070%).
| Demographics | Rating | Rank | 7th Grade |
| Immigrants | Laos | 0.0 /100 | #302 | Tragic 94.5% |
| Sri Lankans | 0.0 /100 | #303 | Tragic 94.4% |
| Immigrants | Haiti | 0.0 /100 | #304 | Tragic 94.3% |
| Guyanese | 0.0 /100 | #305 | Tragic 94.3% |
| Immigrants | Guyana | 0.0 /100 | #306 | Tragic 94.2% |
| Immigrants | Portugal | 0.0 /100 | #307 | Tragic 94.2% |
| Cape Verdeans | 0.0 /100 | #308 | Tragic 94.1% |
| Ecuadorians | 0.0 /100 | #309 | Tragic 94.0% |
| Immigrants | Caribbean | 0.0 /100 | #310 | Tragic 94.0% |
| Puerto Ricans | 0.0 /100 | #311 | Tragic 94.0% |
| Immigrants | Immigrants | 0.0 /100 | #312 | Tragic 94.0% |
| Immigrants | Bangladesh | 0.0 /100 | #313 | Tragic 94.0% |
| Japanese | 0.0 /100 | #314 | Tragic 94.0% |
| Vietnamese | 0.0 /100 | #315 | Tragic 93.9% |
| Immigrants | Vietnam | 0.0 /100 | #316 | Tragic 93.9% |
Demographics Similar to Immigrants from Eastern Africa by 7th Grade
In terms of 7th grade, the demographic groups most similar to Immigrants from Eastern Africa are Immigrants from Western Asia (95.6%, a difference of 0.010%), Immigrants from Panama (95.6%, a difference of 0.010%), Immigrants from Eastern Asia (95.6%, a difference of 0.020%), Immigrants from Malaysia (95.6%, a difference of 0.030%), and Native/Alaskan (95.6%, a difference of 0.030%).
| Demographics | Rating | Rank | 7th Grade |
| Samoans | 7.0 /100 | #221 | Tragic 95.7% |
| Laotians | 6.8 /100 | #222 | Tragic 95.7% |
| Immigrants | Syria | 6.7 /100 | #223 | Tragic 95.7% |
| Immigrants | Oceania | 6.7 /100 | #224 | Tragic 95.7% |
| Immigrants | Malaysia | 6.2 /100 | #225 | Tragic 95.6% |
| Immigrants | Eastern Asia | 5.8 /100 | #226 | Tragic 95.6% |
| Immigrants | Western Asia | 5.4 /100 | #227 | Tragic 95.6% |
| Immigrants | Eastern Africa | 5.1 /100 | #228 | Tragic 95.6% |
| Immigrants | Panama | 4.9 /100 | #229 | Tragic 95.6% |
| Natives/Alaskans | 4.2 /100 | #230 | Tragic 95.6% |
| Senegalese | 4.0 /100 | #231 | Tragic 95.6% |
| Costa Ricans | 3.3 /100 | #232 | Tragic 95.5% |
| Immigrants | Indonesia | 3.3 /100 | #233 | Tragic 95.5% |
| Nigerians | 3.0 /100 | #234 | Tragic 95.5% |
| Immigrants | Africa | 2.7 /100 | #235 | Tragic 95.5% |