Ecuadorian vs Cambodian 7th Grade
COMPARE
Ecuadorian
Cambodian
7th Grade
7th Grade Comparison
Ecuadorians
Cambodians
94.0%
7TH GRADE
0.0/ 100
METRIC RATING
309th/ 347
METRIC RANK
96.3%
7TH GRADE
88.3/ 100
METRIC RATING
140th/ 347
METRIC RANK
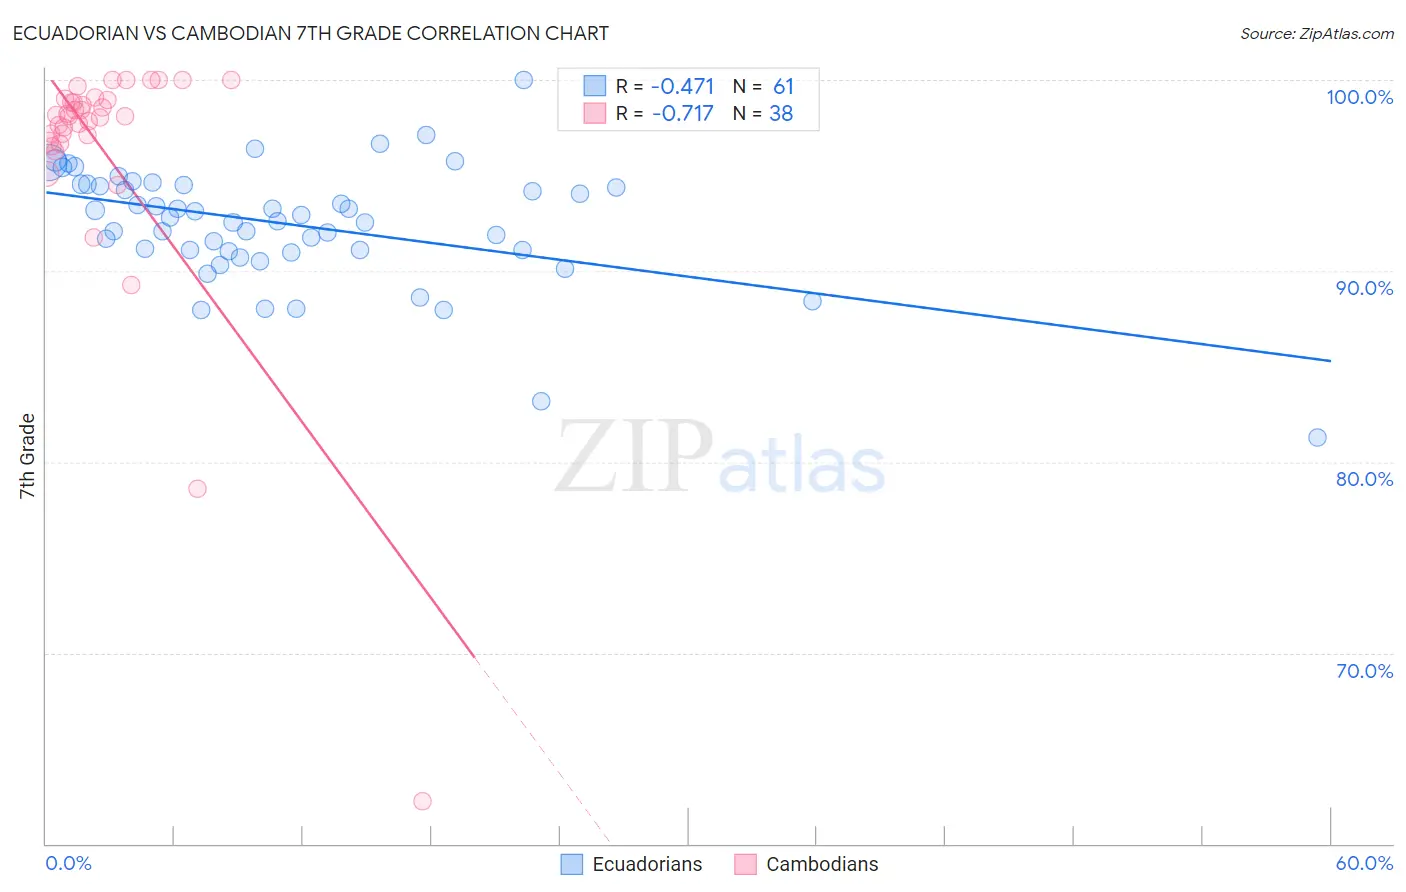
Ecuadorian vs Cambodian 7th Grade Correlation Chart
The statistical analysis conducted on geographies consisting of 317,753,005 people shows a moderate negative correlation between the proportion of Ecuadorians and percentage of population with at least 7th grade education in the United States with a correlation coefficient (R) of -0.471 and weighted average of 94.0%. Similarly, the statistical analysis conducted on geographies consisting of 102,514,976 people shows a strong negative correlation between the proportion of Cambodians and percentage of population with at least 7th grade education in the United States with a correlation coefficient (R) of -0.717 and weighted average of 96.3%, a difference of 2.4%.
7th Grade Correlation Summary
| Measurement | Ecuadorian | Cambodian |
| Minimum | 81.2% | 62.2% |
| Maximum | 100.0% | 100.0% |
| Range | 18.7% | 37.8% |
| Mean | 92.4% | 96.3% |
| Median | 92.8% | 98.1% |
| Interquartile 25% (IQ1) | 91.0% | 96.8% |
| Interquartile 75% (IQ3) | 94.5% | 99.0% |
| Interquartile Range (IQR) | 3.5% | 2.2% |
| Standard Deviation (Sample) | 3.1% | 6.8% |
| Standard Deviation (Population) | 3.1% | 6.7% |
Similar Demographics by 7th Grade
Demographics Similar to Ecuadorians by 7th Grade
In terms of 7th grade, the demographic groups most similar to Ecuadorians are Immigrants from Caribbean (94.0%, a difference of 0.010%), Puerto Rican (94.0%, a difference of 0.020%), Cape Verdean (94.1%, a difference of 0.060%), Immigrants (94.0%, a difference of 0.060%), and Immigrants from Bangladesh (94.0%, a difference of 0.070%).
| Demographics | Rating | Rank | 7th Grade |
| Immigrants | Laos | 0.0 /100 | #302 | Tragic 94.5% |
| Sri Lankans | 0.0 /100 | #303 | Tragic 94.4% |
| Immigrants | Haiti | 0.0 /100 | #304 | Tragic 94.3% |
| Guyanese | 0.0 /100 | #305 | Tragic 94.3% |
| Immigrants | Guyana | 0.0 /100 | #306 | Tragic 94.2% |
| Immigrants | Portugal | 0.0 /100 | #307 | Tragic 94.2% |
| Cape Verdeans | 0.0 /100 | #308 | Tragic 94.1% |
| Ecuadorians | 0.0 /100 | #309 | Tragic 94.0% |
| Immigrants | Caribbean | 0.0 /100 | #310 | Tragic 94.0% |
| Puerto Ricans | 0.0 /100 | #311 | Tragic 94.0% |
| Immigrants | Immigrants | 0.0 /100 | #312 | Tragic 94.0% |
| Immigrants | Bangladesh | 0.0 /100 | #313 | Tragic 94.0% |
| Japanese | 0.0 /100 | #314 | Tragic 94.0% |
| Vietnamese | 0.0 /100 | #315 | Tragic 93.9% |
| Immigrants | Vietnam | 0.0 /100 | #316 | Tragic 93.9% |
Demographics Similar to Cambodians by 7th Grade
In terms of 7th grade, the demographic groups most similar to Cambodians are Basque (96.4%, a difference of 0.020%), Immigrants from South Central Asia (96.3%, a difference of 0.020%), Burmese (96.3%, a difference of 0.020%), Spanish (96.3%, a difference of 0.020%), and Immigrants from Turkey (96.4%, a difference of 0.030%).
| Demographics | Rating | Rank | 7th Grade |
| Hmong | 91.5 /100 | #133 | Exceptional 96.4% |
| Soviet Union | 91.2 /100 | #134 | Exceptional 96.4% |
| Immigrants | Kuwait | 91.1 /100 | #135 | Exceptional 96.4% |
| Immigrants | Hungary | 90.6 /100 | #136 | Exceptional 96.4% |
| Immigrants | Turkey | 90.2 /100 | #137 | Exceptional 96.4% |
| Jordanians | 90.0 /100 | #138 | Excellent 96.4% |
| Basques | 89.3 /100 | #139 | Excellent 96.4% |
| Cambodians | 88.3 /100 | #140 | Excellent 96.3% |
| Immigrants | South Central Asia | 87.1 /100 | #141 | Excellent 96.3% |
| Burmese | 87.1 /100 | #142 | Excellent 96.3% |
| Spanish | 86.6 /100 | #143 | Excellent 96.3% |
| Immigrants | Greece | 85.9 /100 | #144 | Excellent 96.3% |
| Blackfeet | 83.9 /100 | #145 | Excellent 96.3% |
| Immigrants | Eastern Europe | 83.7 /100 | #146 | Excellent 96.3% |
| French American Indians | 83.1 /100 | #147 | Excellent 96.3% |