Ecuadorian vs Immigrants from Guyana 7th Grade
COMPARE
Ecuadorian
Immigrants from Guyana
7th Grade
7th Grade Comparison
Ecuadorians
Immigrants from Guyana
94.0%
7TH GRADE
0.0/ 100
METRIC RATING
309th/ 347
METRIC RANK
94.2%
7TH GRADE
0.0/ 100
METRIC RATING
306th/ 347
METRIC RANK
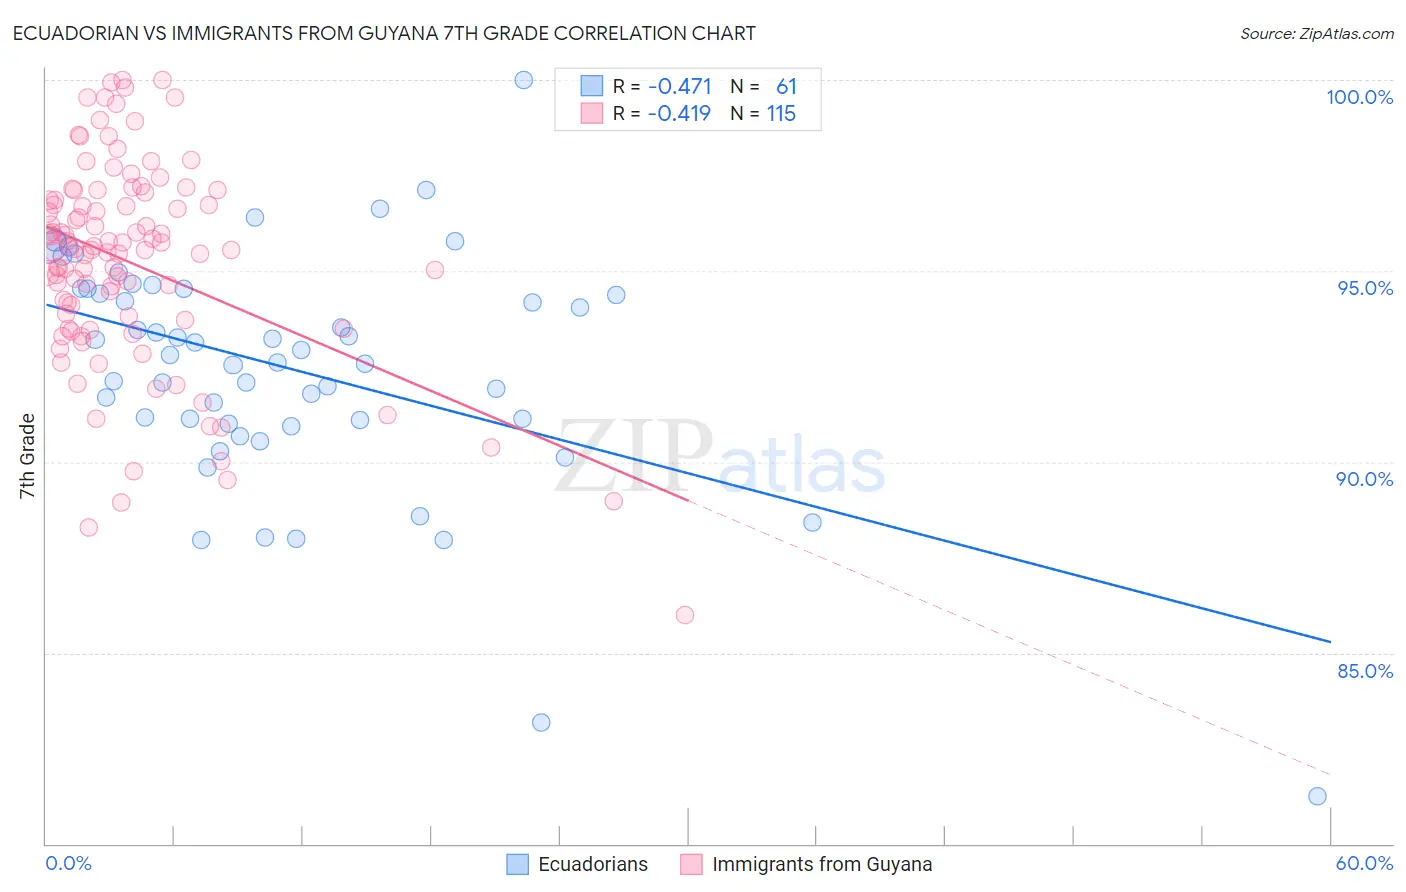
Ecuadorian vs Immigrants from Guyana 7th Grade Correlation Chart
The statistical analysis conducted on geographies consisting of 317,753,005 people shows a moderate negative correlation between the proportion of Ecuadorians and percentage of population with at least 7th grade education in the United States with a correlation coefficient (R) of -0.471 and weighted average of 94.0%. Similarly, the statistical analysis conducted on geographies consisting of 183,673,461 people shows a moderate negative correlation between the proportion of Immigrants from Guyana and percentage of population with at least 7th grade education in the United States with a correlation coefficient (R) of -0.419 and weighted average of 94.2%, a difference of 0.16%.
7th Grade Correlation Summary
| Measurement | Ecuadorian | Immigrants from Guyana |
| Minimum | 81.2% | 86.0% |
| Maximum | 100.0% | 100.0% |
| Range | 18.7% | 14.0% |
| Mean | 92.4% | 95.2% |
| Median | 92.8% | 95.5% |
| Interquartile 25% (IQ1) | 91.0% | 93.7% |
| Interquartile 75% (IQ3) | 94.5% | 96.9% |
| Interquartile Range (IQR) | 3.5% | 3.1% |
| Standard Deviation (Sample) | 3.1% | 2.7% |
| Standard Deviation (Population) | 3.1% | 2.7% |
Demographics Similar to Ecuadorians and Immigrants from Guyana by 7th Grade
In terms of 7th grade, the demographic groups most similar to Ecuadorians are Immigrants from Caribbean (94.0%, a difference of 0.010%), Puerto Rican (94.0%, a difference of 0.020%), Cape Verdean (94.1%, a difference of 0.060%), Immigrants (94.0%, a difference of 0.060%), and Immigrants from Bangladesh (94.0%, a difference of 0.070%). Similarly, the demographic groups most similar to Immigrants from Guyana are Immigrants from Portugal (94.2%, a difference of 0.020%), Cape Verdean (94.1%, a difference of 0.10%), Guyanese (94.3%, a difference of 0.13%), Immigrants from Haiti (94.3%, a difference of 0.15%), and Sri Lankan (94.4%, a difference of 0.18%).
| Demographics | Rating | Rank | 7th Grade |
| Immigrants | South Eastern Asia | 0.0 /100 | #297 | Tragic 94.5% |
| Indonesians | 0.0 /100 | #298 | Tragic 94.5% |
| Bangladeshis | 0.0 /100 | #299 | Tragic 94.5% |
| Immigrants | Burma/Myanmar | 0.0 /100 | #300 | Tragic 94.5% |
| Immigrants | Dominica | 0.0 /100 | #301 | Tragic 94.5% |
| Immigrants | Laos | 0.0 /100 | #302 | Tragic 94.5% |
| Sri Lankans | 0.0 /100 | #303 | Tragic 94.4% |
| Immigrants | Haiti | 0.0 /100 | #304 | Tragic 94.3% |
| Guyanese | 0.0 /100 | #305 | Tragic 94.3% |
| Immigrants | Guyana | 0.0 /100 | #306 | Tragic 94.2% |
| Immigrants | Portugal | 0.0 /100 | #307 | Tragic 94.2% |
| Cape Verdeans | 0.0 /100 | #308 | Tragic 94.1% |
| Ecuadorians | 0.0 /100 | #309 | Tragic 94.0% |
| Immigrants | Caribbean | 0.0 /100 | #310 | Tragic 94.0% |
| Puerto Ricans | 0.0 /100 | #311 | Tragic 94.0% |
| Immigrants | Immigrants | 0.0 /100 | #312 | Tragic 94.0% |
| Immigrants | Bangladesh | 0.0 /100 | #313 | Tragic 94.0% |
| Japanese | 0.0 /100 | #314 | Tragic 94.0% |
| Vietnamese | 0.0 /100 | #315 | Tragic 93.9% |
| Immigrants | Vietnam | 0.0 /100 | #316 | Tragic 93.9% |
| Immigrants | Cuba | 0.0 /100 | #317 | Tragic 93.8% |