Central American Indian vs Immigrants from Eastern Africa 7th Grade
COMPARE
Central American Indian
Immigrants from Eastern Africa
7th Grade
7th Grade Comparison
Central American Indians
Immigrants from Eastern Africa
93.3%
7TH GRADE
0.0/ 100
METRIC RATING
325th/ 347
METRIC RANK
95.6%
7TH GRADE
5.1/ 100
METRIC RATING
228th/ 347
METRIC RANK
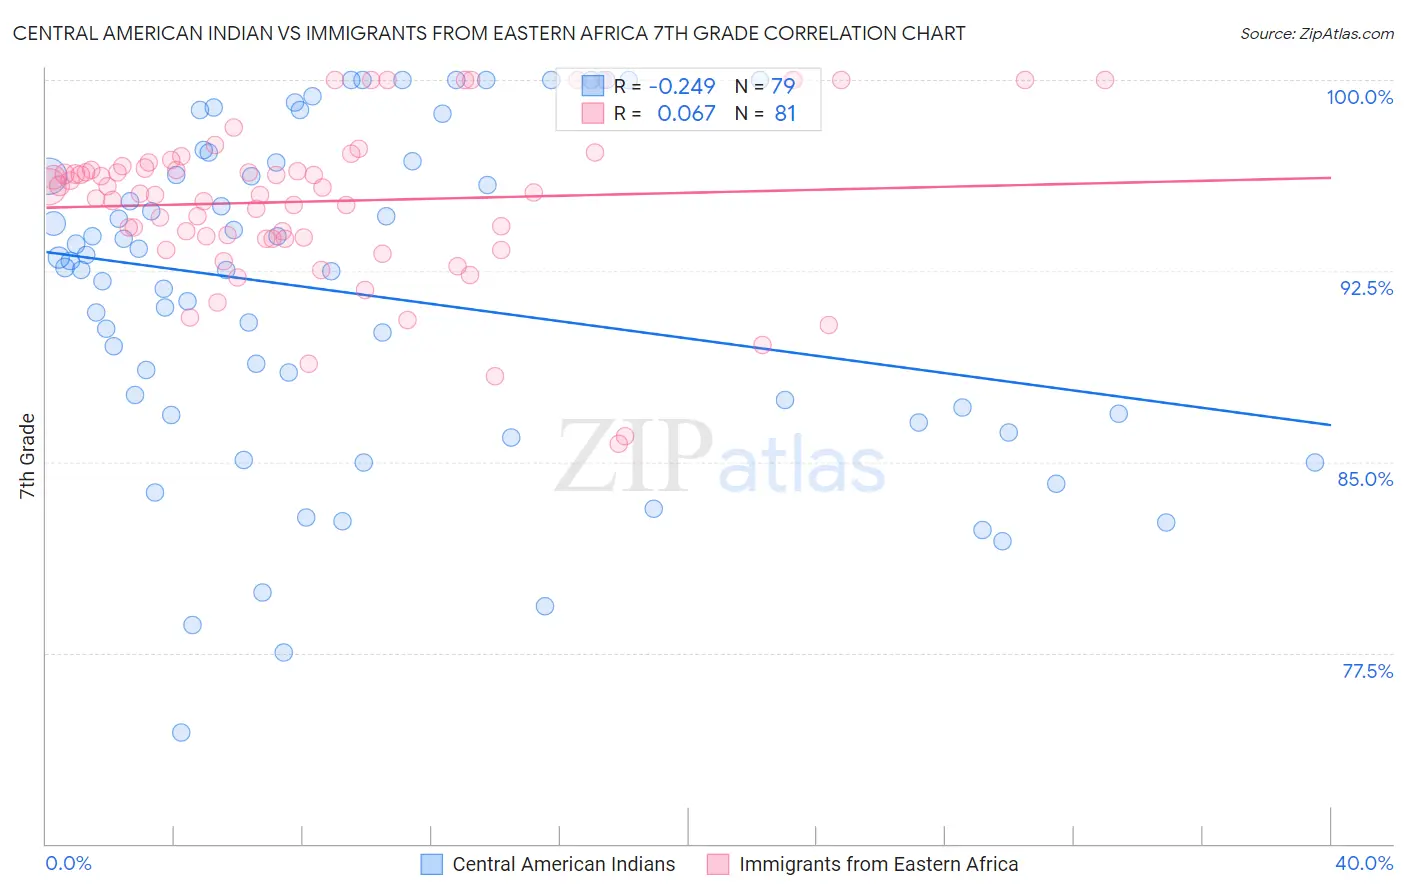
Central American Indian vs Immigrants from Eastern Africa 7th Grade Correlation Chart
The statistical analysis conducted on geographies consisting of 326,142,643 people shows a weak negative correlation between the proportion of Central American Indians and percentage of population with at least 7th grade education in the United States with a correlation coefficient (R) of -0.249 and weighted average of 93.3%. Similarly, the statistical analysis conducted on geographies consisting of 355,144,184 people shows a slight positive correlation between the proportion of Immigrants from Eastern Africa and percentage of population with at least 7th grade education in the United States with a correlation coefficient (R) of 0.067 and weighted average of 95.6%, a difference of 2.5%.
7th Grade Correlation Summary
| Measurement | Central American Indian | Immigrants from Eastern Africa |
| Minimum | 74.4% | 85.7% |
| Maximum | 100.0% | 100.0% |
| Range | 25.6% | 14.3% |
| Mean | 91.6% | 95.2% |
| Median | 92.6% | 95.6% |
| Interquartile 25% (IQ1) | 86.8% | 93.8% |
| Interquartile 75% (IQ3) | 96.8% | 96.7% |
| Interquartile Range (IQR) | 9.9% | 2.9% |
| Standard Deviation (Sample) | 6.4% | 3.1% |
| Standard Deviation (Population) | 6.4% | 3.1% |
Similar Demographics by 7th Grade
Demographics Similar to Central American Indians by 7th Grade
In terms of 7th grade, the demographic groups most similar to Central American Indians are Dominican (93.3%, a difference of 0.070%), Immigrants from Belize (93.4%, a difference of 0.080%), Nepalese (93.2%, a difference of 0.11%), Immigrants from Cabo Verde (93.1%, a difference of 0.18%), and Nicaraguan (93.5%, a difference of 0.20%).
| Demographics | Rating | Rank | 7th Grade |
| Immigrants | Ecuador | 0.0 /100 | #318 | Tragic 93.7% |
| Immigrants | Cambodia | 0.0 /100 | #319 | Tragic 93.7% |
| Immigrants | Fiji | 0.0 /100 | #320 | Tragic 93.5% |
| Belizeans | 0.0 /100 | #321 | Tragic 93.5% |
| Nicaraguans | 0.0 /100 | #322 | Tragic 93.5% |
| Immigrants | Belize | 0.0 /100 | #323 | Tragic 93.4% |
| Dominicans | 0.0 /100 | #324 | Tragic 93.3% |
| Central American Indians | 0.0 /100 | #325 | Tragic 93.3% |
| Nepalese | 0.0 /100 | #326 | Tragic 93.2% |
| Immigrants | Cabo Verde | 0.0 /100 | #327 | Tragic 93.1% |
| Immigrants | Nicaragua | 0.0 /100 | #328 | Tragic 93.0% |
| Immigrants | Azores | 0.0 /100 | #329 | Tragic 93.0% |
| Immigrants | Dominican Republic | 0.0 /100 | #330 | Tragic 92.9% |
| Hondurans | 0.0 /100 | #331 | Tragic 92.9% |
| Hispanics or Latinos | 0.0 /100 | #332 | Tragic 92.7% |
Demographics Similar to Immigrants from Eastern Africa by 7th Grade
In terms of 7th grade, the demographic groups most similar to Immigrants from Eastern Africa are Immigrants from Western Asia (95.6%, a difference of 0.010%), Immigrants from Panama (95.6%, a difference of 0.010%), Immigrants from Eastern Asia (95.6%, a difference of 0.020%), Immigrants from Malaysia (95.6%, a difference of 0.030%), and Native/Alaskan (95.6%, a difference of 0.030%).
| Demographics | Rating | Rank | 7th Grade |
| Samoans | 7.0 /100 | #221 | Tragic 95.7% |
| Laotians | 6.8 /100 | #222 | Tragic 95.7% |
| Immigrants | Syria | 6.7 /100 | #223 | Tragic 95.7% |
| Immigrants | Oceania | 6.7 /100 | #224 | Tragic 95.7% |
| Immigrants | Malaysia | 6.2 /100 | #225 | Tragic 95.6% |
| Immigrants | Eastern Asia | 5.8 /100 | #226 | Tragic 95.6% |
| Immigrants | Western Asia | 5.4 /100 | #227 | Tragic 95.6% |
| Immigrants | Eastern Africa | 5.1 /100 | #228 | Tragic 95.6% |
| Immigrants | Panama | 4.9 /100 | #229 | Tragic 95.6% |
| Natives/Alaskans | 4.2 /100 | #230 | Tragic 95.6% |
| Senegalese | 4.0 /100 | #231 | Tragic 95.6% |
| Costa Ricans | 3.3 /100 | #232 | Tragic 95.5% |
| Immigrants | Indonesia | 3.3 /100 | #233 | Tragic 95.5% |
| Nigerians | 3.0 /100 | #234 | Tragic 95.5% |
| Immigrants | Africa | 2.7 /100 | #235 | Tragic 95.5% |